
Recursive Yield
What the RWA Yield Is Actually Made Of


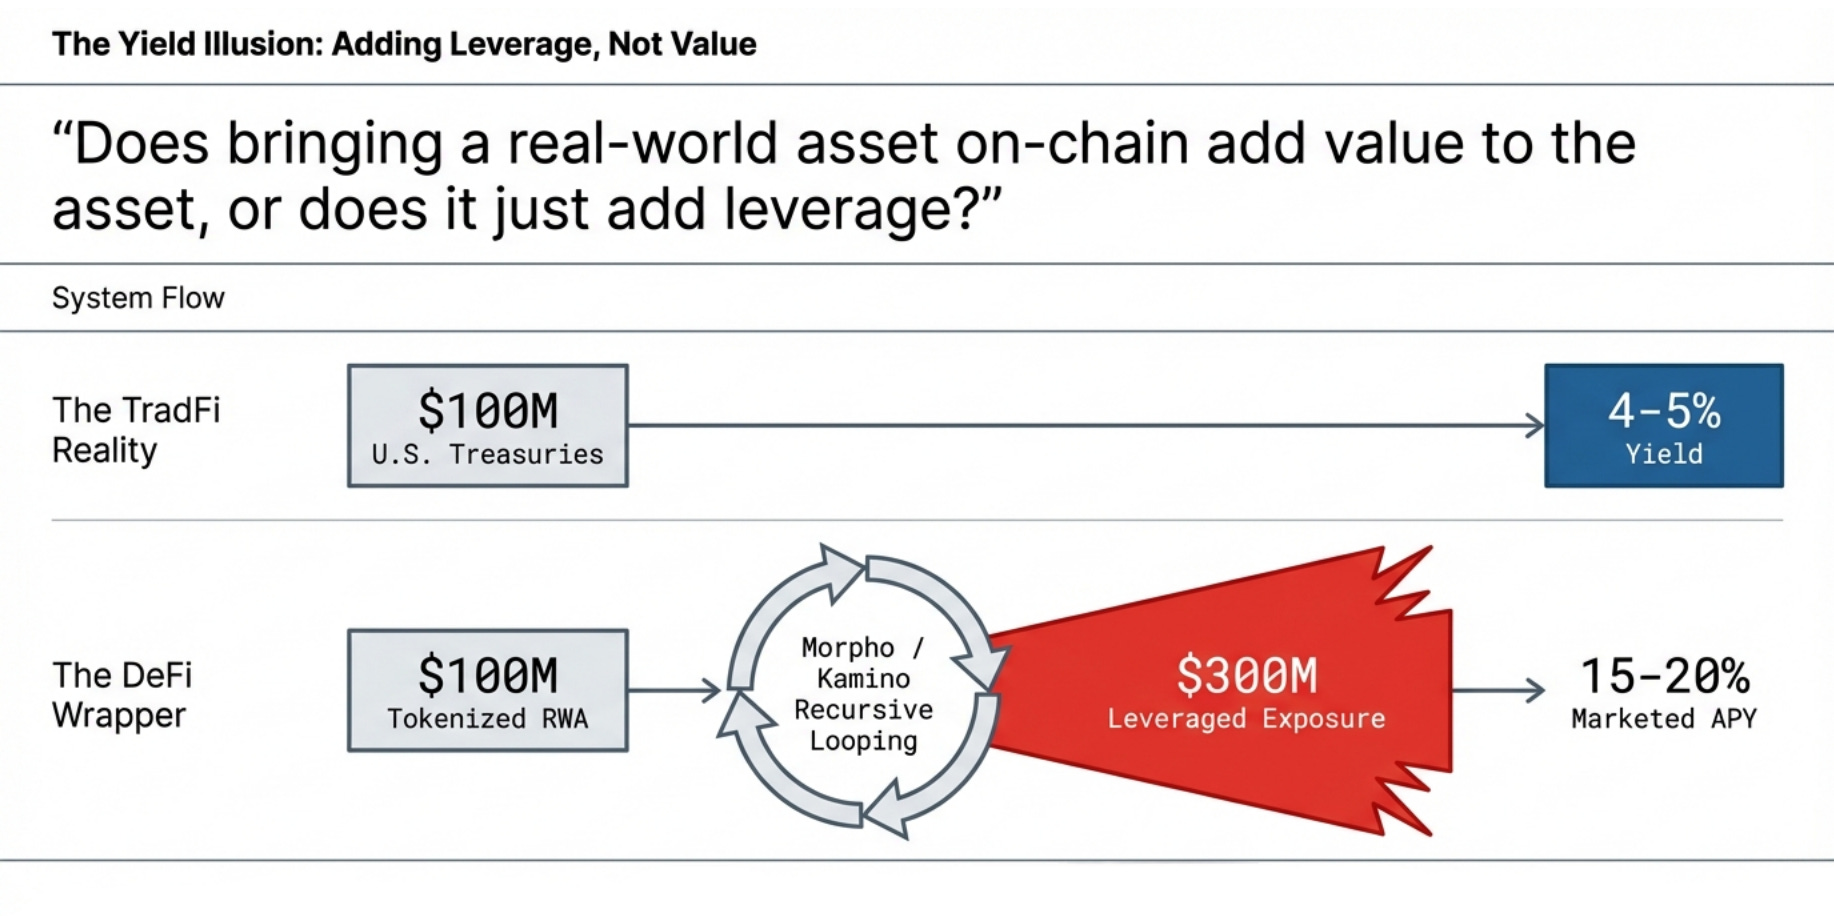
There is a question at the center of the $27B RWA market that nobody will say out loud: does bringing a real-world asset on-chain add value to the asset, or does it just add leverage?
A tokenized Treasury yields 4-5% in TradFi and 4-5% on-chain. If the yield is the same, DeFi added a wrapper, not value. The accessibility case is real: fractional ownership, 24/7 settlement, global distribution. The yield case is not. Because the yields being marketed are not 5%. They are 15-20%. And the gap between 5% and 20% is not innovation or efficiency. It is borrowed money.
Apollo’s ACRED is explicitly positioned for “yield amplification up to 16% through leverage looping on Morpho, Kamino, and Drift.” Kamino advertises >23% APY on PRIME looping. OnRe advertises “looping strategies achieve 20%+ APY” on reinsurance products. Huma Finance trademarked “Defensive Looping.” The looping is not a side effect. It IS the product. The RWA is the collateral. The leverage is the yield.
I have spent the last few days building onchain monitoring infrastructure for RWA lending markets. Six custom Dune queries, triple-validated against onchain contract state and external data sources. What we found changed our position on the entire sector.
The dominant use case of tokenized real-world assets in DeFi is not institutional credit. It is recursive leverage. And the risk architecture being built around it has a structural gap at its center that nobody is measuring, nobody is disclosing, and nobody has an incentive to fix. Every participant in the value chain earns fees proportional to volume. The tail risk falls elsewhere. This matters for who will eventually close the gap, and who won’t.
I. The Gap
The gap is between accounting equity and executable equity.
Every DeFi lending protocol reports equity as the difference between collateral value and outstanding debt. Deposit $100M, borrow $90M, equity is $10M, leverage is 10x. The arithmetic is correct. The question is whether that $10M represents something recoverable.
For liquid assets, it does. If a borrower has $100M in wstETH and $90M in debt, a liquidator seizes and sells on Uniswap in the same block. The equity is real because the mechanism designed to recover it works.
For tokenized private credit, the same arithmetic produces a number that may correspond to nothing recoverable. Apollo’s ACRED is an interval fund with quarterly redemptions limited to 5% per period. Midas mF-ONE holds private credit from fintech receivables to real-estate-backed lending. PRIME tokens on Kamino represent tokenized U.S. home equity loans. These assets have real yield. They also have redemption queues, quarterly gates, no liquid secondary markets, and NAV marks that update daily at best, quarterly at worst.
A liquidator seizing sACRED cannot sell it. Not in seconds, not in minutes, not in days. They must wait for the next quarterly redemption window, request up to 5% of the fund, and hope the NAV doesn’t drop further during the wait. The risk-adjusted return on holding illiquid private credit through a stress event is likely negative. Rational liquidators won’t bid. Bad debt accumulates. The accounting equity that made the leverage ratio look manageable turns out to be a number the system can’t actually recover.
The system currently shows $151M protecting $1.32B in high-leverage positions on Morpho Blue alone. Some fraction of that $151M is executable. Some fraction is phantom. Nobody knows the ratio. And nobody with an economic interest in the current structure has an incentive to find out.
II. The Ecosystem: Who Is Doing What and at What Scale
RWA looping is not a single-protocol phenomenon. It spans multiple chains, multiple lending platforms, and multiple collateral types. The market discussion focuses almost exclusively on Apollo’s sACRED. The data tells a different story about where the real exposure sits.
The Platform Landscape
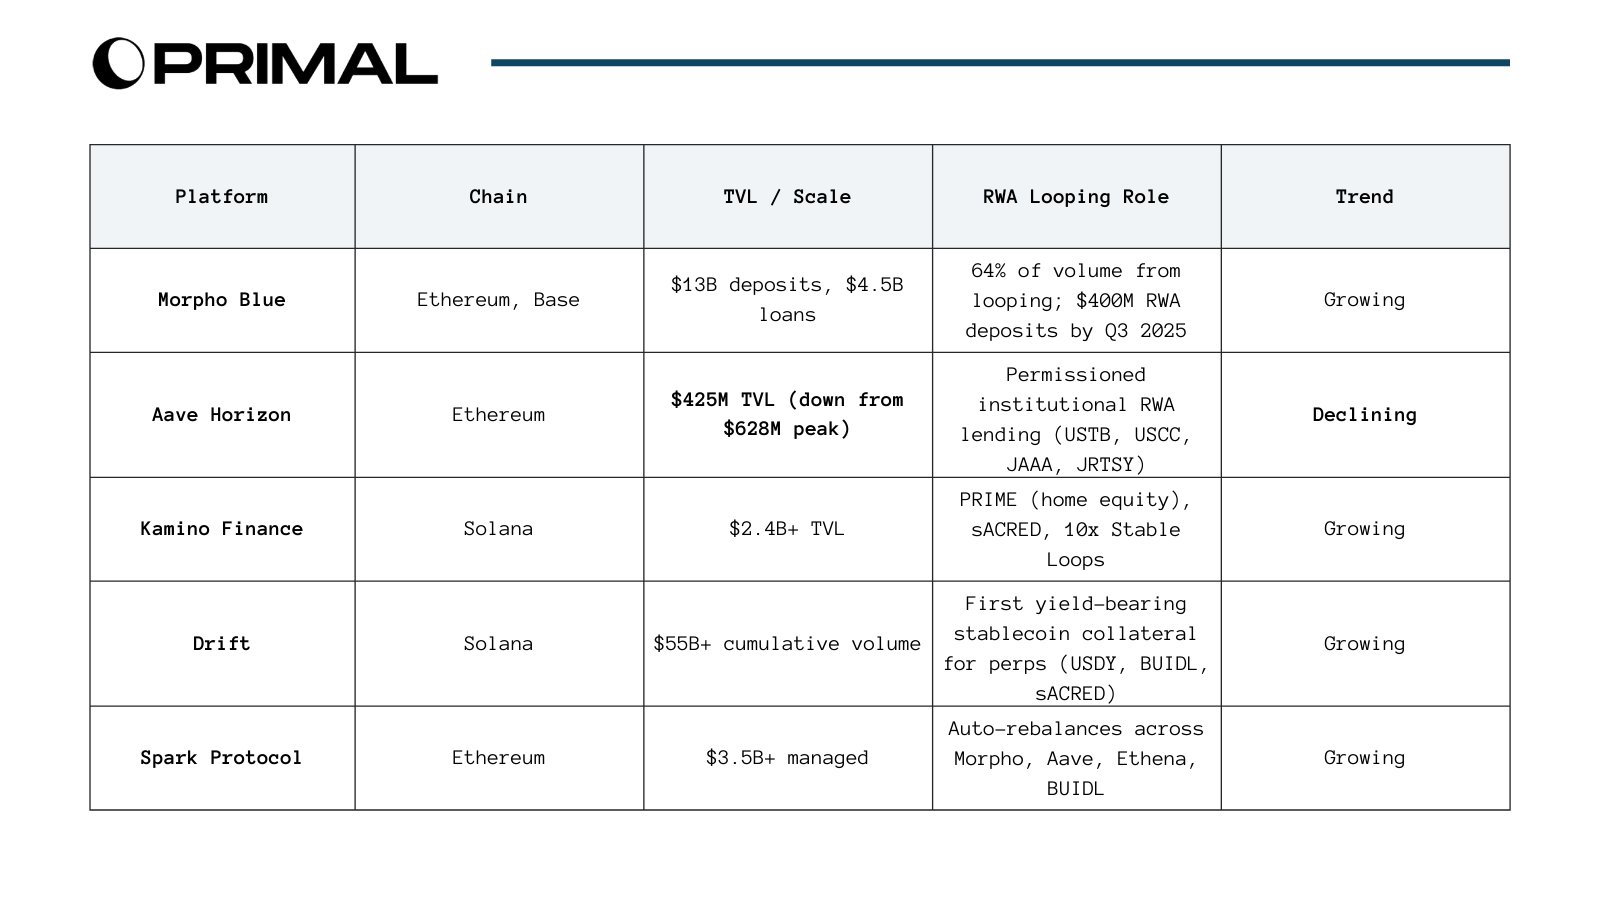
And we wonder why nobody’s discussing this but Aave Horizon, the most institutional and compliant RWA lending platform, is the only one in decline. Every other platform is growing. This divergence is a leading indicator. Horizon has the best collateral (tokenized Treasuries from Superstate and Centrifuge), the best compliance framework, and the deepest institutional partnerships (Circle, Ripple, Securitize, VanEck). Yet institutional borrowers are leaving.
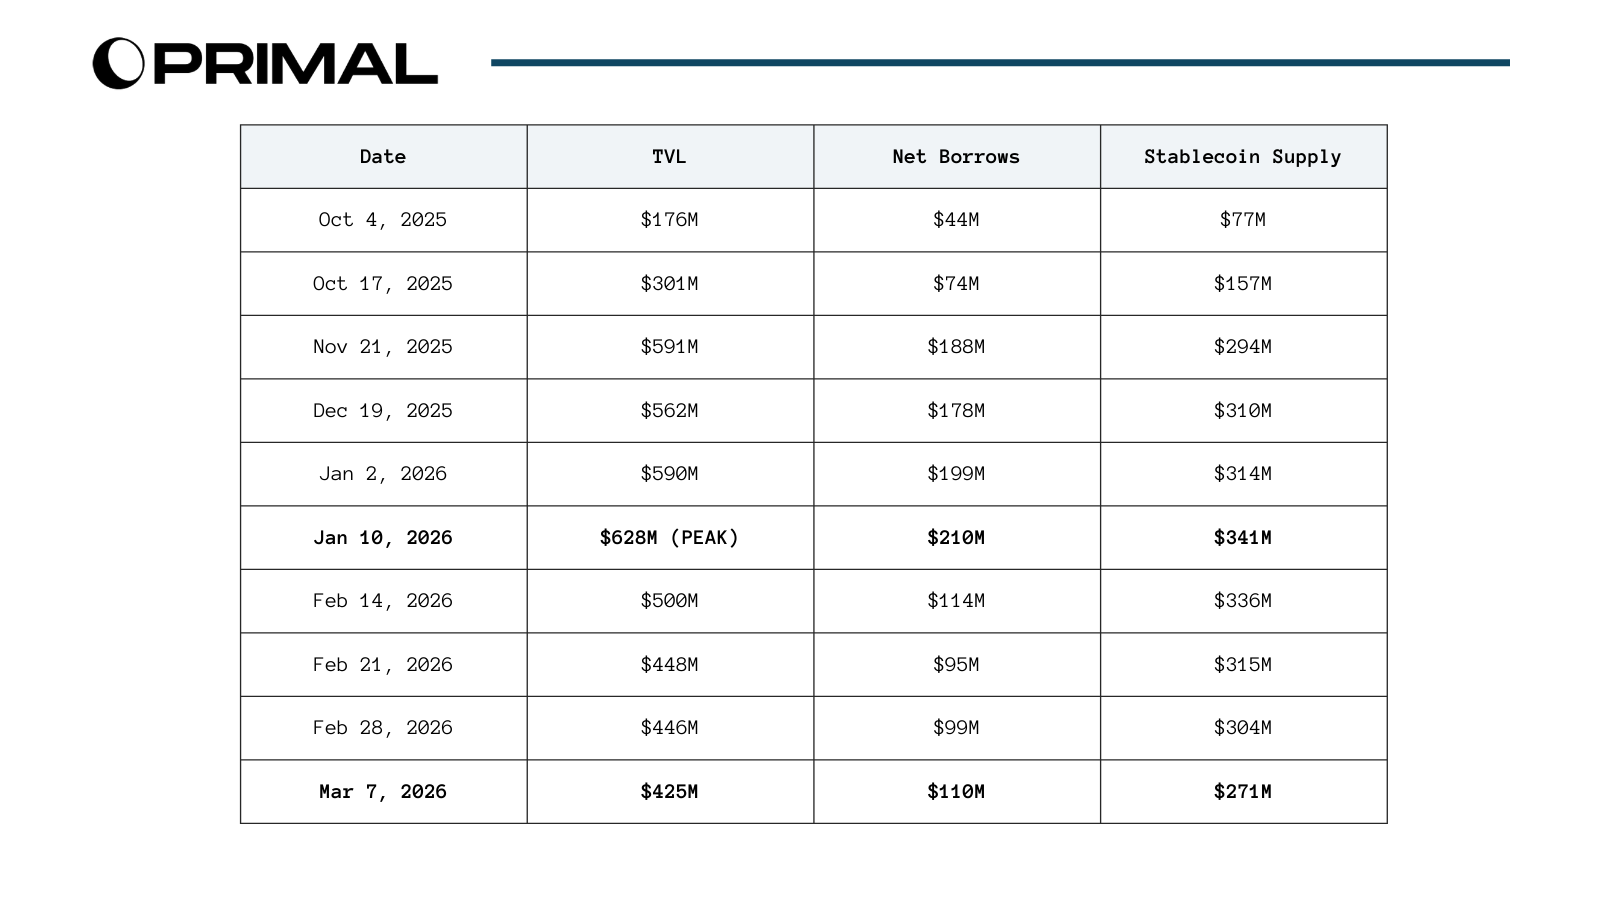
Net borrows collapsed 48% from peak and haven’t recovered. TVL fell 32%. LlamaRisk attributed this to “ongoing lower yields for carry trades and, more generally, in the DeFi ecosystem.”
We believe that the narrative says “institutions are scaling into RWA looping.” The positioning data shows institutions reducing leveraged RWA exposure at the most regulated venue. The borrowers left. The stablecoin suppliers (earning subsidized yield) stayed longer but are now also declining ($341M peak to $271M). This is the classic pattern of a yield farm winding down: the capital that came for incentives leaves when the economics stop working.
And if the carry trade doesn’t work at Aave Horizon with the most liquid RWA collateral (tokenized Treasuries with T+1 redemption), it definitely doesn’t work for illiquid private credit on permissionless protocols where the structural risks are orders of magnitude higher. Horizon’s decline would not just be a data point about one platform. It would end up as a falsification signal for the yield spread assumption underpinning the entire RWA looping thesis.
III. We Have Seen This Before
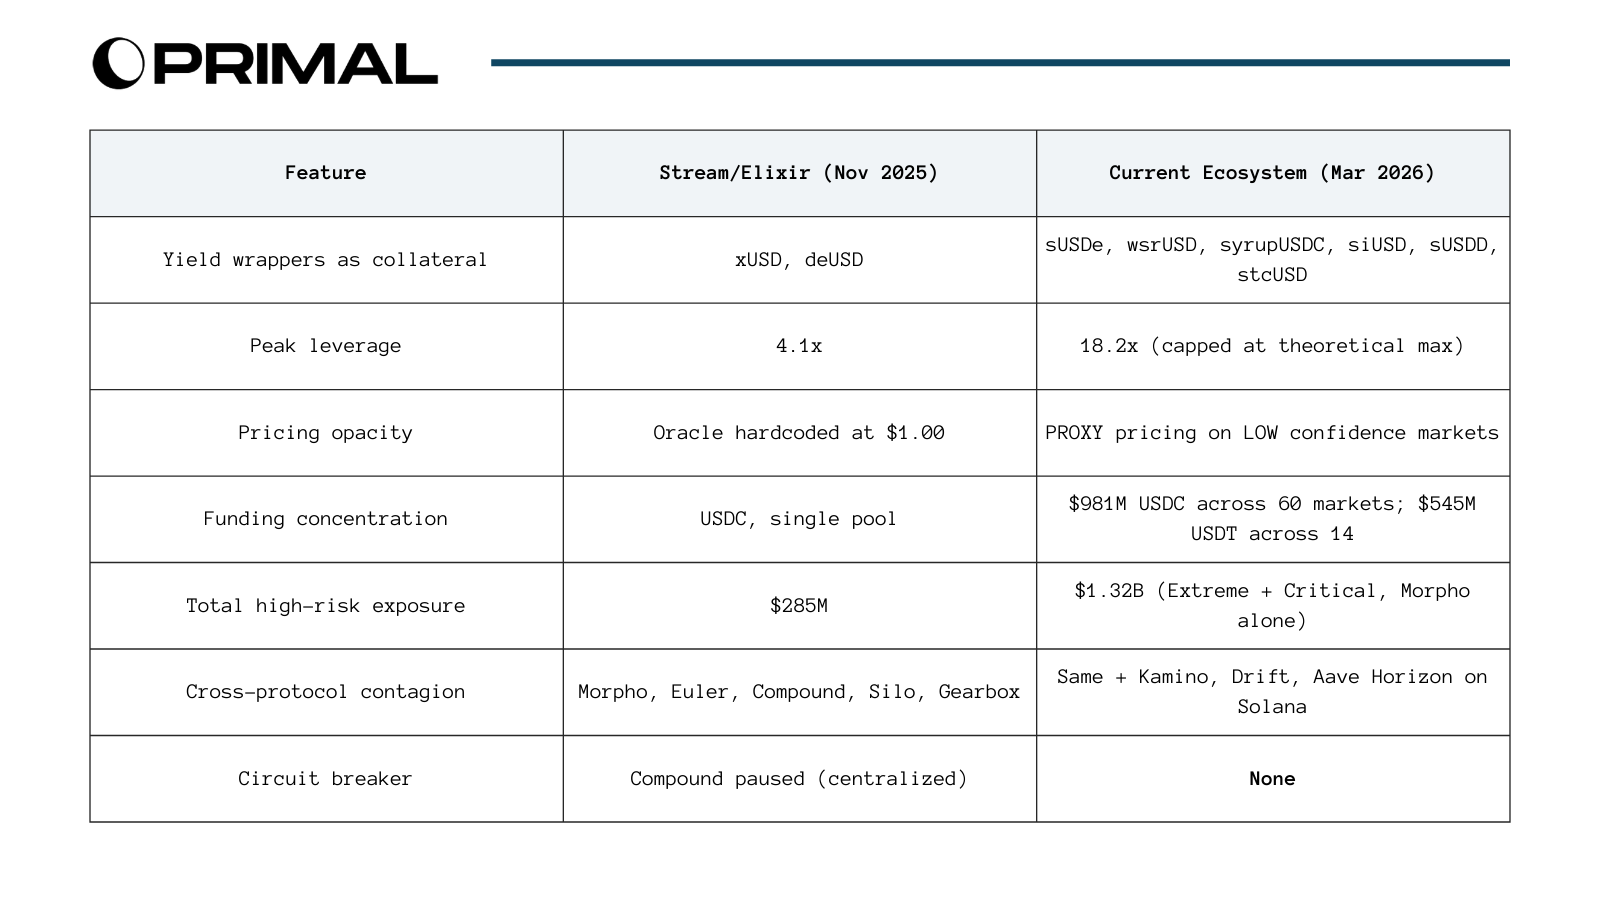
In November 2025, Stream Finance offered 18% APY via xUSD, marketed as “diversified market-neutral strategies.” Under the hood: social media allegations cited a $170M asset base against $530M in loans, suggesting heavy leverage. Yearn developer Schlag flagged before the collapse that “with the same 1.9 million USDC, they minted approximately 14.5 million xUSD” -- a 7.6x leverage ratio through recursive cross-minting. Elixir Network’s deUSD had 65% of its backing, $68M, parked with Stream through private Morpho vaults invisible to public analytics. Stream held 90% of all deUSD. Elixir held 90% of all xUSD. Each inflating the other’s TVL through recursive dependency, marketed to depositors as “institutional yield.”
When a fund manager lost $93M, $285M cascaded across five lending protocols. Compound paused stablecoin markets. $1B fled DeFi yield platforms in a single week. Elixir “sunset” deUSD, processed partial redemptions with capital borrowed from Euler, Morpho, and Compound (how they intend to repay those protocols is still unclear), and pivoted. Nobody was sanctioned.
The industry learned the wrong lesson. “Bad actors. System contained. Crisis averted.” The containment was luck, not design. Compound’s centralized team paused markets manually. That authority exists on Compound. It does not exist on Morpho Blue, where markets are isolated and permissionless by design. The same feature that makes individual markets safe (no shared risk pools) makes the aggregate uncontrollable (no system-wide circuit breaker).
Four months later, the architecture is the same. The scale is larger. The peak leverage is higher. And there is still no circuit breaker.
IV. Inside the Machine: The Morpho Blue Case Study
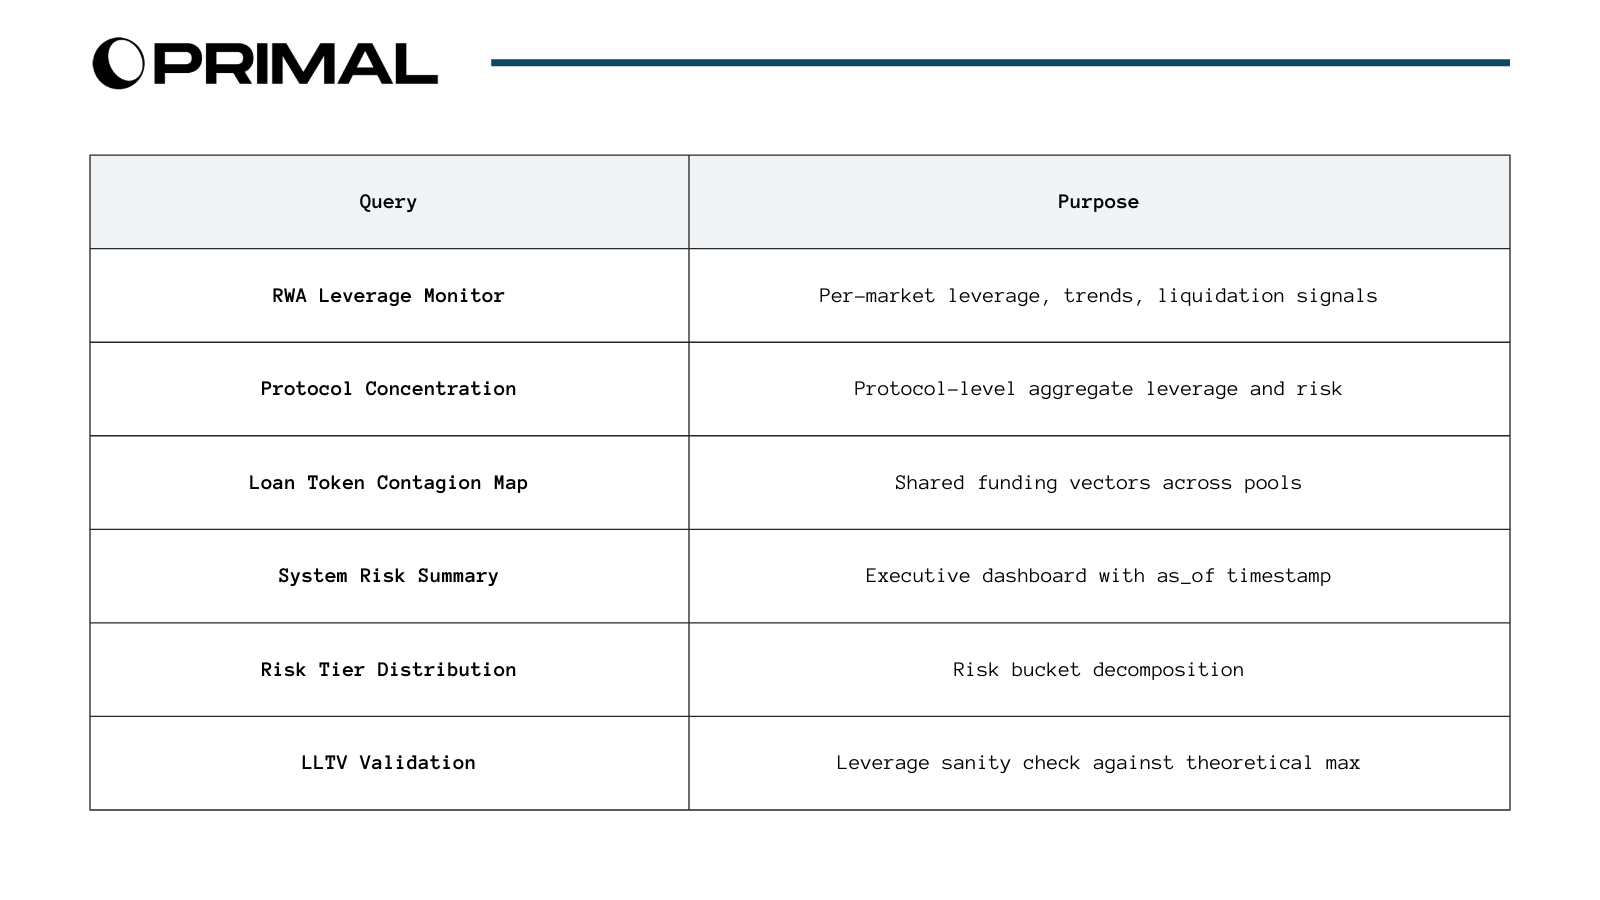
Morpho Blue is the largest venue for RWA looping on Ethereum and the only one with enough onchain data granularity to analyze at market level. We built six custom Dune queries to decompose the system. What follows is not a summary of the data. It’s an analysis of what the data reveals about the structural fragility of leveraged RWA positions.
System Dashboard
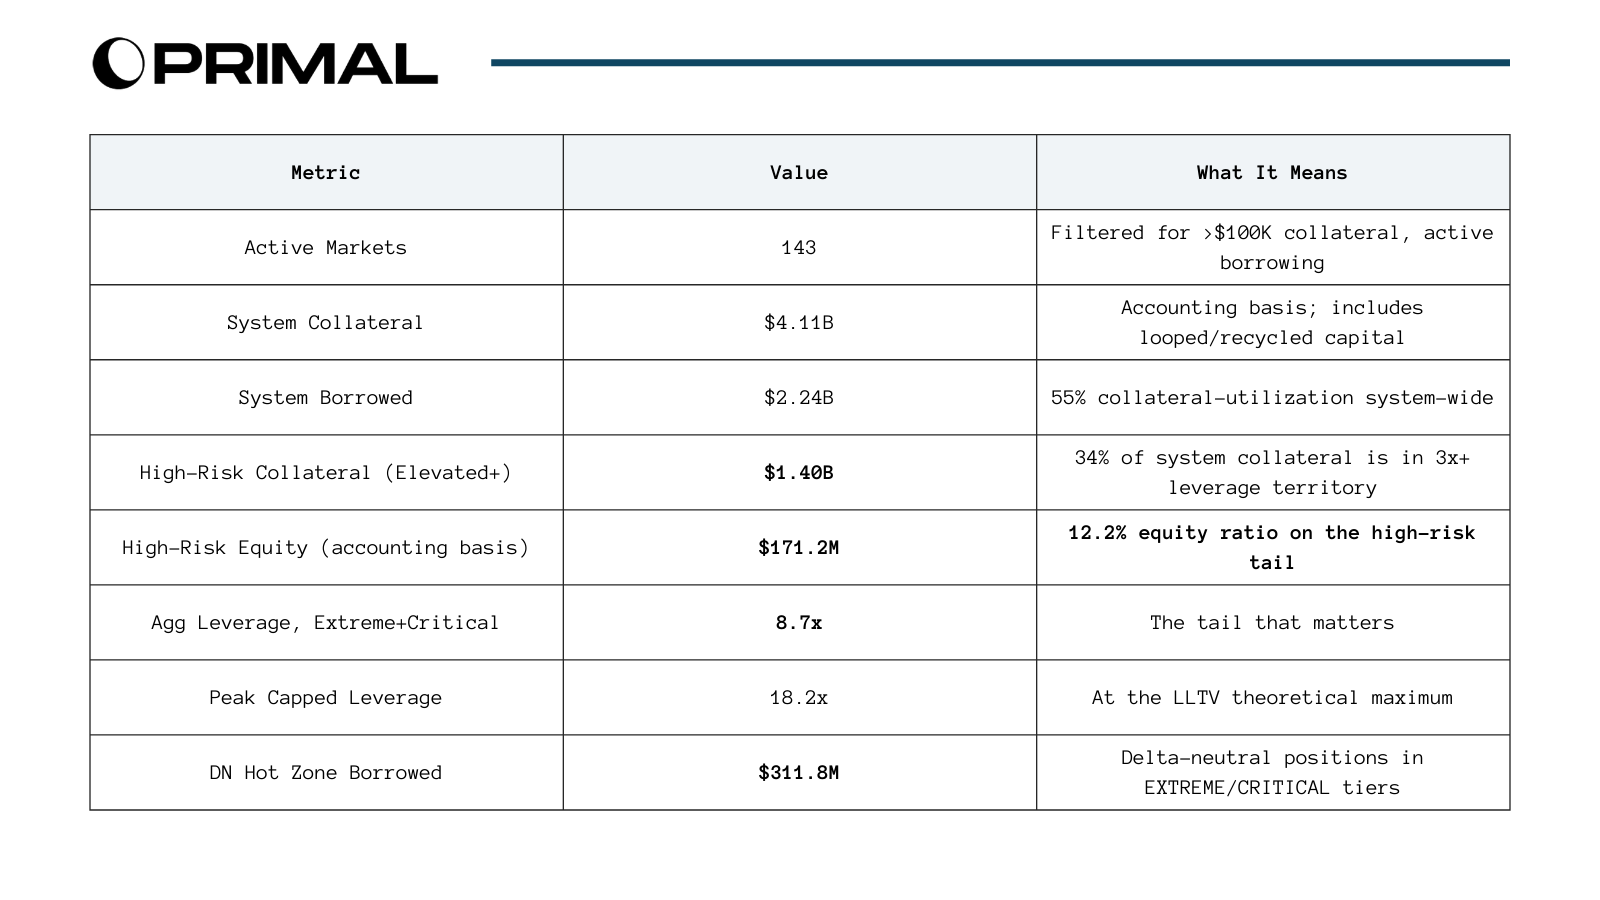
The system-wide numbers are misleading by design. $4.1B collateral at 55% utilization and 1.8x system leverage looks healthy. But 34% of the collateral ($1.4B) is concentrated in high-leverage markets with only $171.2M in accounting equity, a 12.2% ratio. The other 66% sits safely at 1.6x in NORMAL-tier markets. The headline “system leverage” averages the safe majority with the dangerous minority, making the system look safer than it is.
The delta-neutral hot zone is the hidden concentration. $312M in borrowed stablecoins sit in delta-neutral carry trades (Ethena sUSDe, TRON sUSDD, Noon sUSN) classified as EXTREME or CRITICAL. These positions are marketed as “market-neutral” because the collateral and loan are both dollar-denominated. But “delta-neutral” means no directional price risk. It does NOT mean no liquidation risk, no oracle risk, or no funding risk. Every one of these positions unwinds when the borrow rate exceeds the collateral yield. Delta-neutrality is about price direction. The risk here is about carry, funding, and liquidity.
Risk Tier Analysis
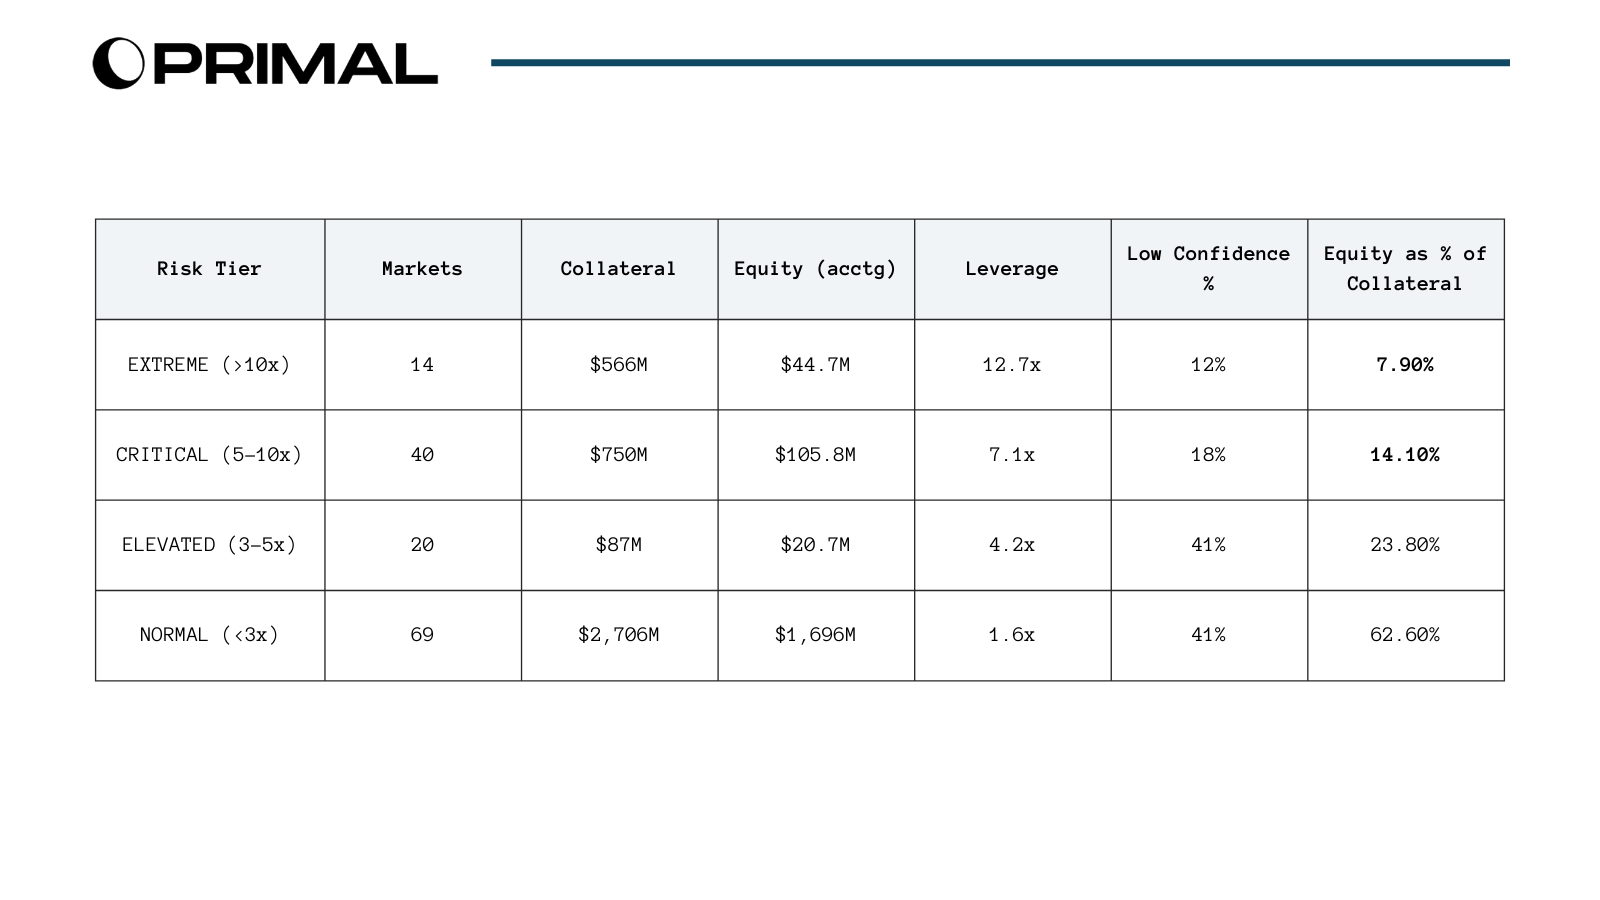
The critical number: 7.9% equity ratio in the EXTREME tier. $44.7M protecting $566M in collateral running at 12.7x leverage. A 7.9% drawdown across these markets exhausts the accounting equity completely. For proxy-priced collateral with NAV updates that lag by days or weeks, a 7.9% information gap during credit stress is the expected behavior, not a tail scenario.
The price confidence gradient reveals where accounting equity diverges from executable equity. 12% of EXTREME tier collateral has LOW confidence pricing (PROXY), rising to 18% in CRITICAL, 41% in ELEVATED. This means: the higher the leverage tier, the BETTER the pricing confidence, because the largest extreme-leverage positions (Sky sUSDS, Ethena sUSDe, wstETH/WETH) have live market prices. The LOW confidence risk is concentrated in mid-tier markets (Pendle PT tokens, Midas) where the positions are smaller but the pricing is entirely guesswork.
This inverts the expected risk pattern. You’d expect the most dangerous positions to have the worst pricing. Instead, the most dangerous positions (by leverage) have the best pricing, while the mid-tier has the worst. The implication: the EXTREME tier numbers are trustworthy but the CRITICAL tier numbers may be systematically misstating equity. The $106M in CRITICAL equity is 18% low-confidence, meaning roughly $19M could be phantom accounting equity with no executable backing.
Protocol Concentration: Where the Narrative Meets the Data
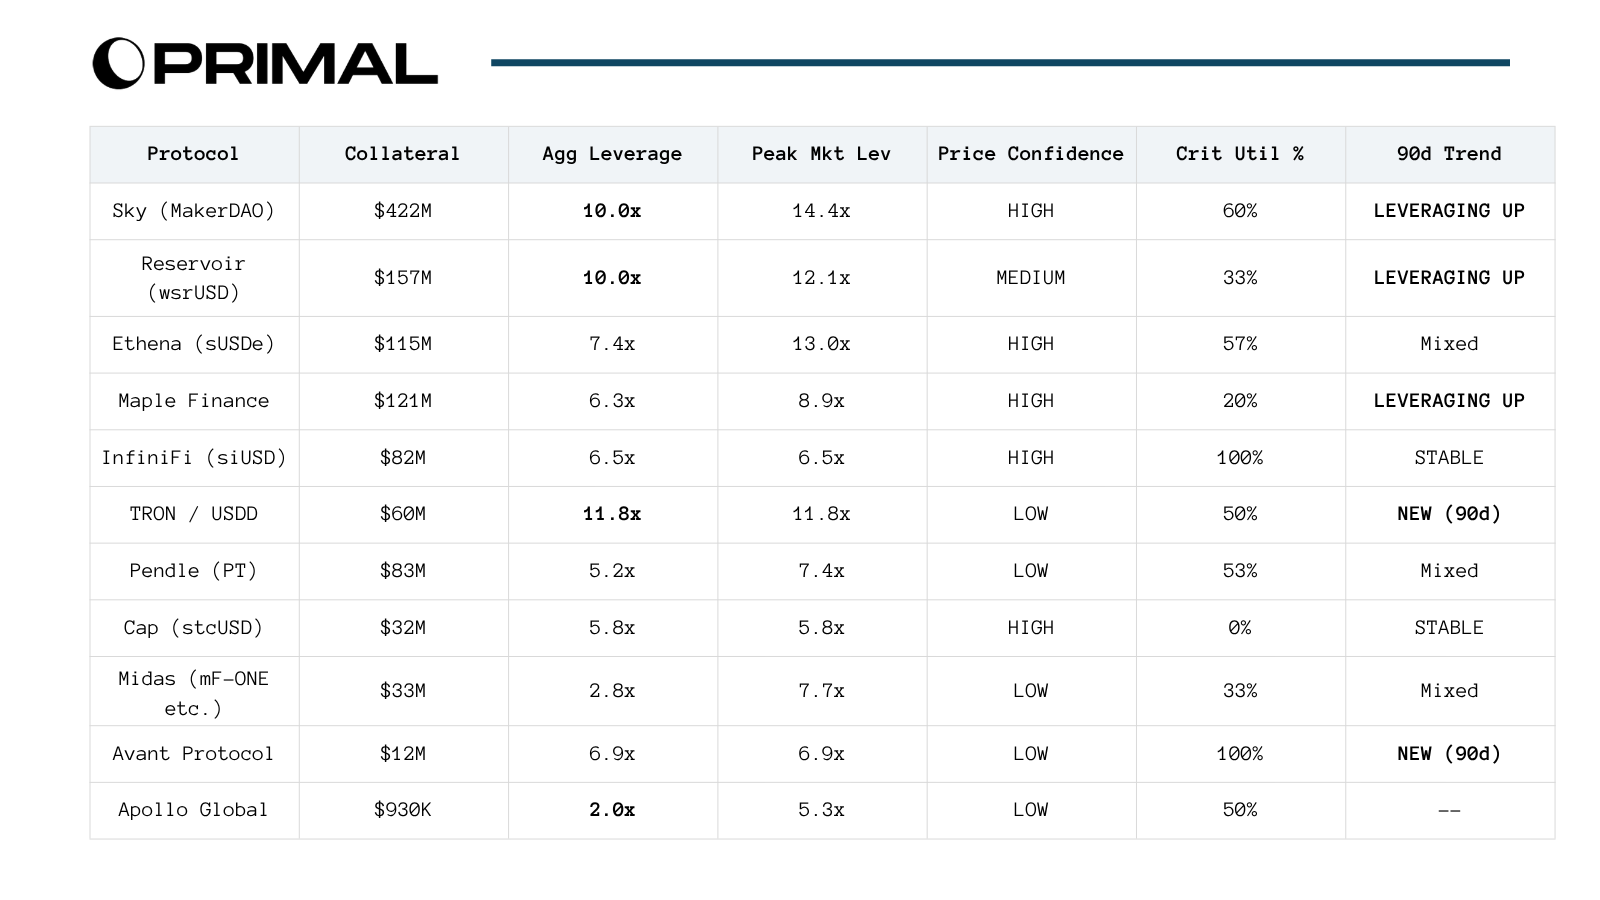
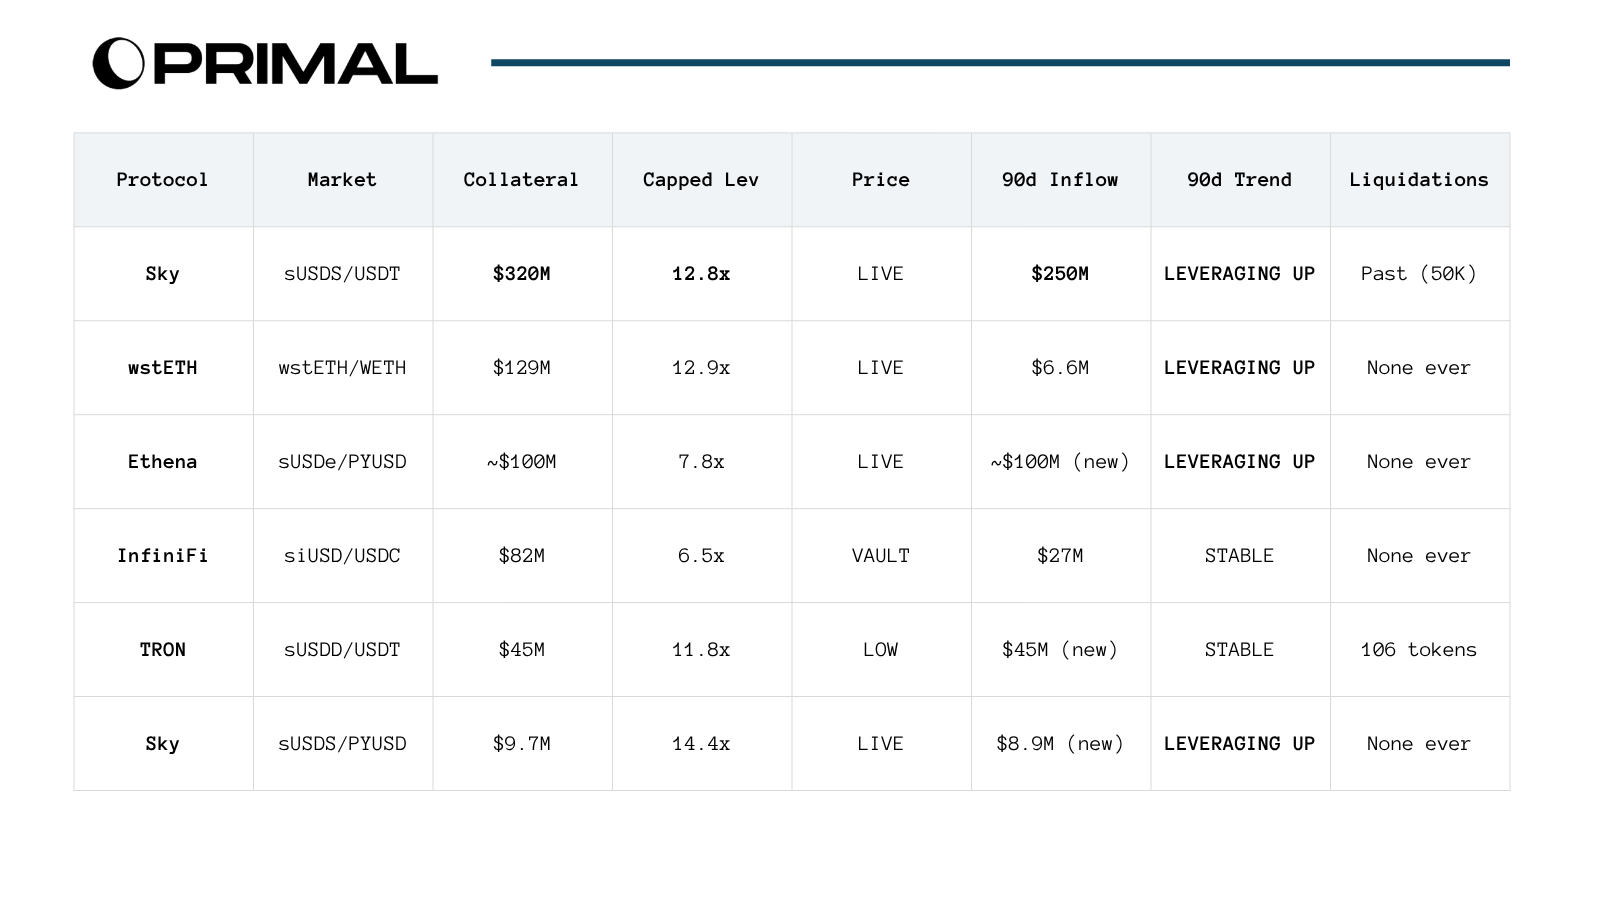
Five things this table reveals that the market is not pricing:
1. Sky/MakerDAO is the systemic risk, not Apollo. $422M at 10x leverage, with a single sUSDS/USDT market holding $320M at 12.8x. The 90-day collateral flow shows $250M in new inflows, meaning this massive position was built almost entirely in the last three months. Nobody in the RWA looping discourse mentions Sky. Everyone mentions Apollo. Apollo has $930K on Ethereum Morpho. The narrative and the positioning are in completely different places.
And in return, Sky/MakerDAO is aggressively deploying capital into leveraged sUSDS positions across USDT, PYUSD, and USDS funding markets simultaneously. At 60% critical utilization across their markets and 14.4x peak leverage, this is the most aggressive institutional looping strategy on Morpho by a factor of 450x over Apollo. Sky either has conviction the carry trade persists, or they’re using leverage to manufacture yield for the Sky Savings Rate to remain competitive against Ethena and other yield sources. Either way, they’re the whale in the room.
2. Apollo, the poster child, is a rounding error. $930K on Ethereum. Two markets. 2x leverage. The most-cited example in every RWA looping article has essentially no meaningful position on Ethereum Morpho. The real sACRED deployments are on Polygon (Gauntlet-curated) and Solana (Kamino, Drift). But nobody knows the total leveraged exposure across all chains because no analytics platform aggregates it. This is an information asymmetry: the market thinks Apollo is the flagship RWA looping exposure. The data says it’s virtually absent from the largest venue.
3. TRON/USDD appeared in the last 90 days at 11.8x leverage on $60M. The entire position was built in the current quarter. 100% proxy-priced. LOW confidence. 50% critical utilization. This is someone aggressively deploying capital into a Justin Sun ecosystem stablecoin wrapper at near-max leverage. The counterparty risk profile (TRON governance, Justin Sun’s track record) adds a layer the quantitative data can’t capture. Nobody in the RWA discourse is tracking this because sUSDD doesn’t fit the “institutional RWA” narrative. But it IS a leveraged carry trade on a yield-bearing stablecoin, and it’s 64x larger than Apollo’s Ethereum position.
4. The HIGH vs LOW confidence split is a roadmap for where the gap lives. Sky ($422M), Ethena ($115M), InfiniFi ($82M), Maple ($121M), and Cap ($32M) all have HIGH or MEDIUM confidence pricing via live market prices or onchain vault rates. Their equity readings are trustworthy. The gap between accounting and executable equity for these protocols is small and driven primarily by the liquidation mismatch (can you actually sell the collateral?), not by pricing error.
TRON/USDD ($60M), Pendle ($83M), Midas ($33M), Avant ($12M), Apollo ($930K), and smaller protocols are 100% LOW confidence. Their equity is calculated by assuming the collateral is worth the same as the loan token. For yield-bearing tokens, this systematically understates collateral value (the yield premium is invisible). For credit-bearing tokens, it could go either way. The point: $175M+ in protocol-level collateral has equity readings that are educated guesses, not market-verified numbers.
5. The leverage is growing, not shrinking. Sky is LEVERAGING UP. Maple is LEVERAGING UP. The highest-risk positions are actively getting bigger. Fresh capital is entering at high leverage while Aave Horizon borrowers (the institutional benchmark) are pulling back. This divergence between permissioned-institutional behavior (deleveraging) and permissionless behavior (leveraging up) is a risk signal. The capital entering permissionless venues is accepting risks that institutional capital at regulated venues is actively exiting.
The Contagion Map: Shared Funding Across “Isolated” Pools
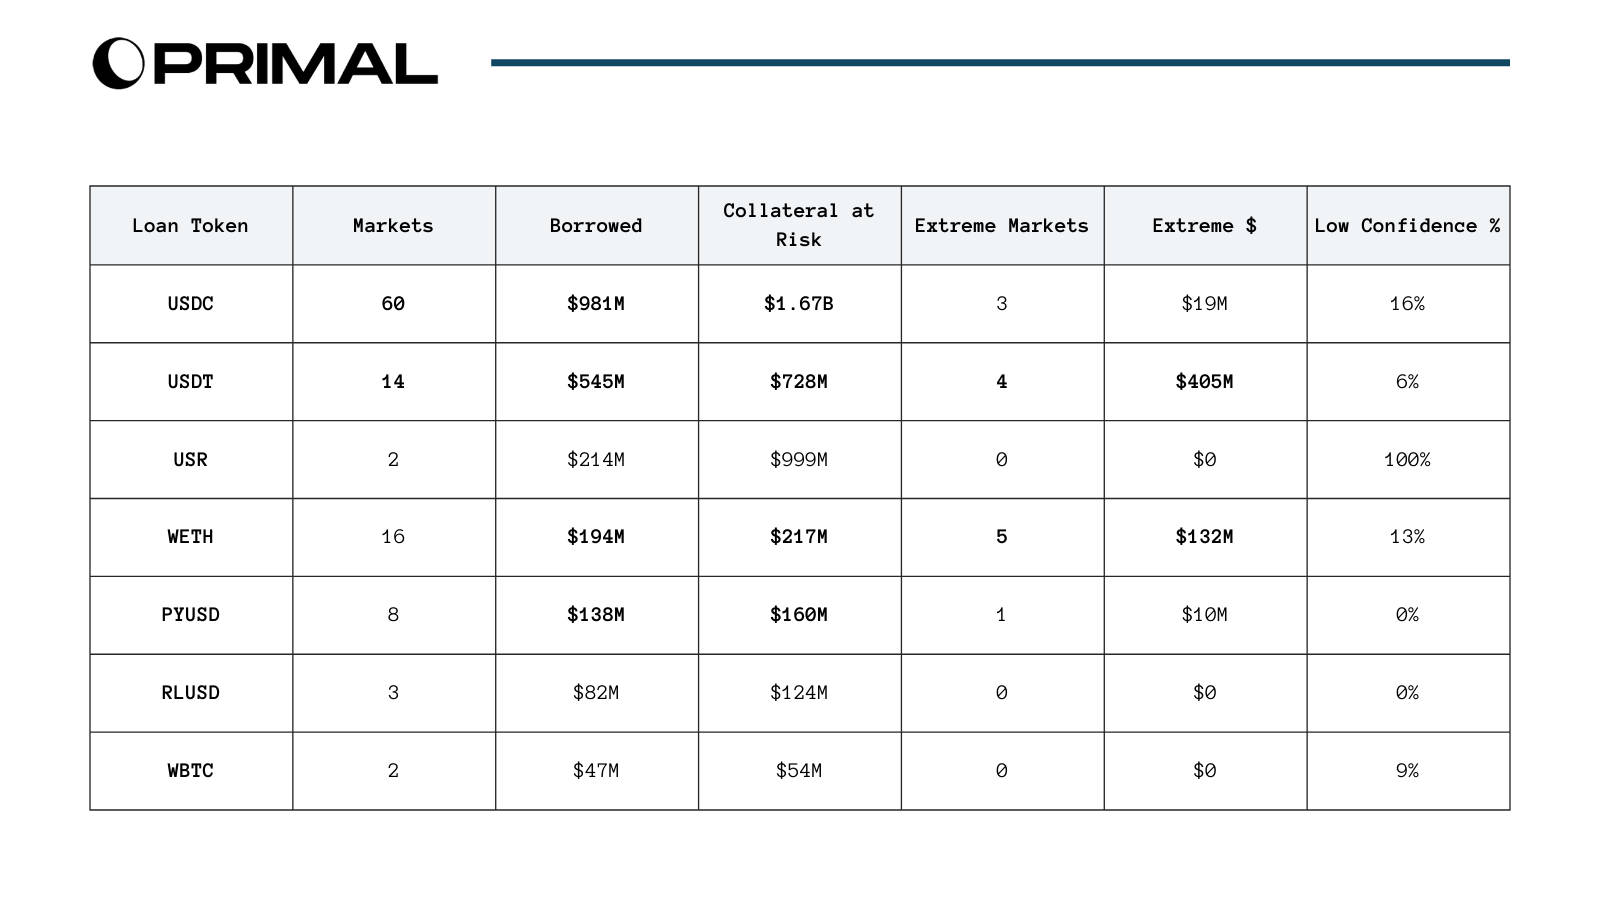
USDT is more dangerous than USDC on every dimension that matters. USDC has more markets (60 vs 14) and more total borrowed ($981M vs $545M), so it looks like the bigger contagion vector. But USDT has 21x the extreme-market collateral ($405M vs $19M), higher aggregate leverage (4.1x vs 2.4x), and the extreme risk is concentrated in just two positions: Sky sUSDS/USDT ($320M at 12.8x) and TRON sUSDD/USDT ($45M at 11.8x).
A USDT-specific stress scenario (rate spike, depeg event, or regulatory action against Tether) puts $728M in collateral at risk across just 14 markets. This is a concentrated, correlated exposure that Morpho’s isolated pool architecture does nothing to mitigate. The pools are isolated on the collateral side. They share USDT funding.
PYUSD is the sleeper. PayPal’s stablecoin has quietly become the 5th largest funding token on Morpho: $138M borrowed across 8 markets at 7.5x aggregate leverage. The biggest PYUSD market is Ethena sUSDe/PYUSD at ~$100M+. Nobody in the RWA looping discourse tracks PYUSD as a risk factor. But it’s now larger than RLUSD ($82M) and approaching WETH ($194M). The question: if PayPal faces regulatory pressure on PYUSD (not unlikely given stablecoin legislation dynamics), what happens to $160M in collateral that depends on PYUSD borrow markets?
RLUSD (Ripple) emerged as a new funding vector. $82M across 3 markets, up from negligible in earlier runs. Maple’s syrupUSDC is borrowing RLUSD alongside USDC and PYUSD. The RWA looping ecosystem is diversifying its funding sources, which looks like risk reduction but is actually adding new, less battle-tested stablecoins to the contagion map.
The Top Markets: Where Capital Is Actually Flowing
The 90-day inflow column is the most important column in this table. It shows where fresh capital is deploying right now:
$250M flowed into Sky sUSDS/USDT in 90 days. This single market absorbed more new capital than all of Aave Horizon’s remaining net borrows ($110M). The capital that institutions are pulling from the regulated venue is going into permissionless leverage at 12.8x on Morpho.
The Ethena sUSDe/PYUSD pool (~$100M) is similarly new.
The entire TRON sUSDD position ($60M across two pools) was built in the last 90 days.
The liquidation column tells you the mechanism hasn’t been tested. Every single market over $10M in collateral shows either zero liquidations or trivially small historical liquidations. The Sky sUSDS/USDT market has $320M at 12.8x leverage and 49,827 tokens in all-time liquidations (worth roughly $54K at current prices). That’s a 0.017% liquidation rate on a $320M position. The liquidation mechanism for these yield-bearing RWA collateral types is not battle-tested. We are running $1.32B in high-leverage collateral on a liquidation system whose stress performance is entirely theoretical.
V. The Four Mechanisms That Widen the Gap
Mechanism 1: The Liquidation Mismatch
DeFi lending protocols are engineered for seconds-to-minutes liquidation. The entire architecture, from oracle feeds to liquidation incentives to MEV infrastructure, assumes collateral can be atomically seized and sold onchain.
For tokenized private credit, this assumption fails:
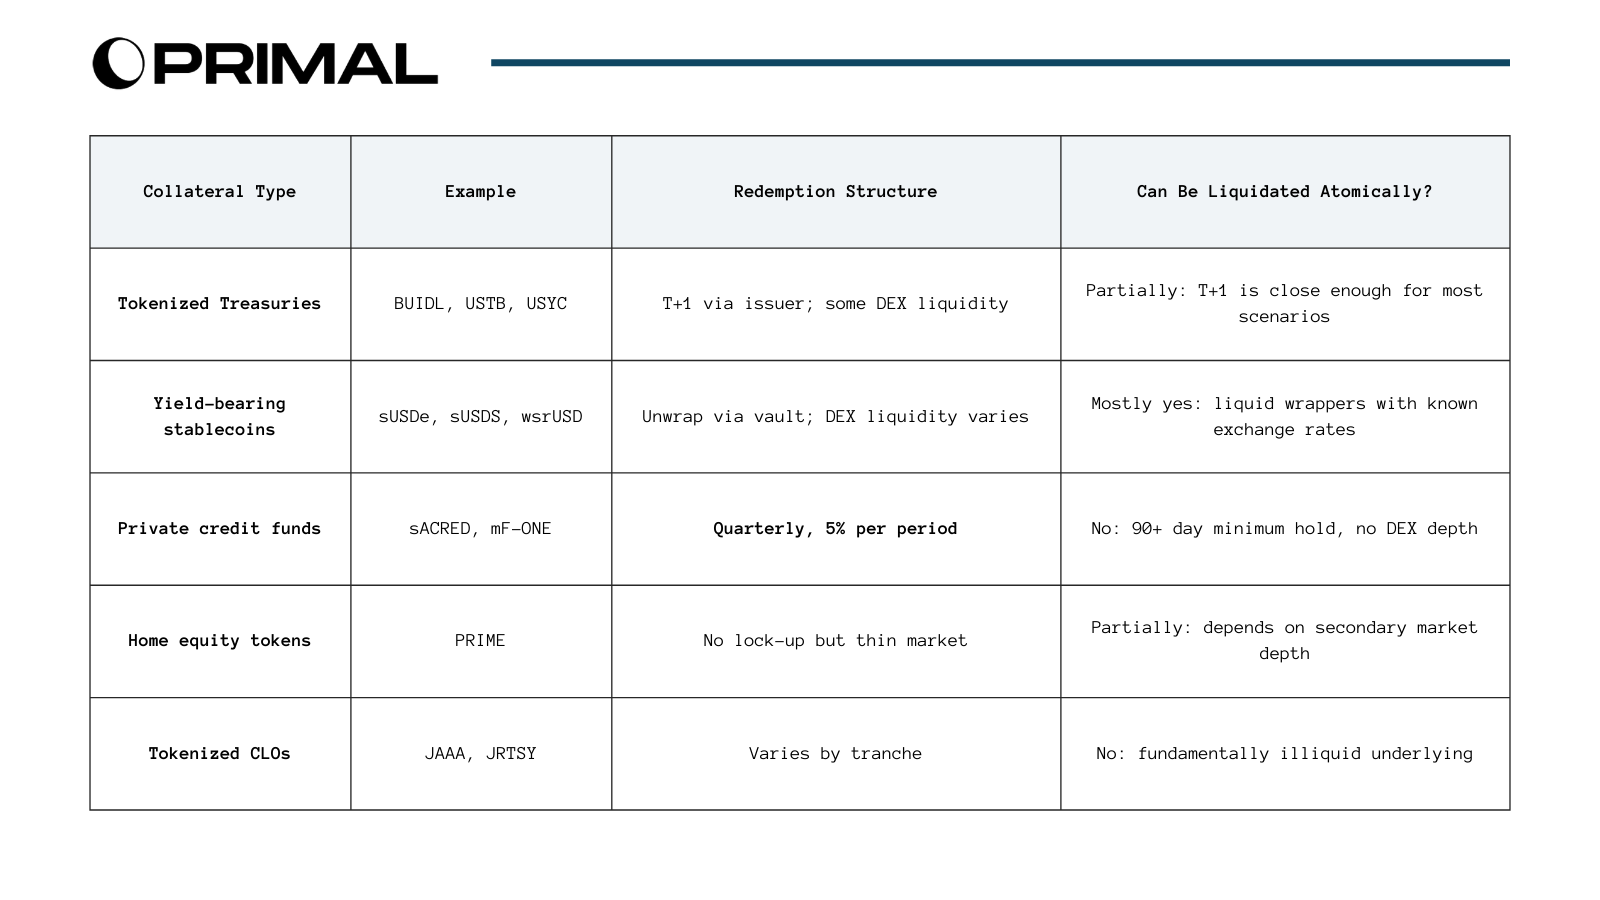
The mismatch is not a parameter that can be tuned. You can adjust the LTV. You can increase the liquidation bonus. You can hire the best risk curators. None of it changes the fact that quarterly-redemption collateral can’t be liquidated in a seconds-to-minutes framework.
The liquidator’s calculus for sACRED: Seize the collateral at a 5-10% discount. Hold for 3+ months. Accept only 5% redemption per quarter. Bear NAV decline risk during hold. Fund the position with own capital. At 5-10% liquidation bonus on a 3-month hold: ~20-40% annualized return on capital. But the return comes with credit risk (NAV could drop further), liquidity risk (can’t exit early), and concentration risk (holding a single fund). The risk-adjusted return is likely negative. Rational liquidators won’t bid.
Hence, When positions go underwater, bad debt accumulates. The accounting equity that made the leverage ratio look manageable turns out to be a number that can’t be recovered. The gap opens.
We already have a concrete example of what happens when large positions meet thin liquidity.
Last week, a CoW Protocol solver routed a $50.4M collateral swap (17,958 WETH) through a SushiSwap V2 pool that held only 331.63 AAVE and 17.65 WETH -- the input was approximately 1,017x the pool's existing WETH reserve. The user received roughly 324 AAVE tokens worth approximately $36,000 in exchange for $50.4M, a 99.9% loss on execution. MEV bots captured approximately $34M in value from the transaction. Every smart contract executed correctly. Aave core, CoW settlement, Uniswap, SushiSwap -- all worked as designed. The Aave interface displayed a "High price impact (99.9%)" warning requiring the user to manually check a box confirming acceptance; the user confirmed on a mobile device. The catastrophe was a routing failure in the software stack above the contracts.
Mechanism 2: Structural Oracle Staleness
This is not a critique of RedStone or Chainlink NAVLink. The oracle infrastructure is technically robust. The problem is that the data it carries is structurally stale for private credit.
Apollo’s Diversified Credit Fund holds corporate direct lending, asset-backed lending, CLOs, RMBS, CMBS. NAV is calculated by the fund administrator using mark-to-model valuations. During credit stress, actual values drop days or weeks before the NAV catches up. Corporate defaults happen. Recovery rates get revised. CLO tranches reprice. The oracle faithfully transmits the stale NAV with low latency. The pipeline is fast. The input is old.
Our queries handle this through price confidence flags: LIVE (market price, high confidence), VAULT RATE (ERC-4626 exchange rate, medium), PROXY (loan token fallback, low). The flag system is honest about its limitations. What it can’t capture is the staleness gradient within each category: a stablecoin wrapper that updates daily is very different from a private credit fund that marks quarterly. Both show up as the same confidence level.
The circular dependency: The lending protocol trusts the fund administrator’s NAV. The NAV assumes orderly markets. Orderly markets assume the lending protocol functions correctly. Under stress, all three assumptions fail simultaneously: NAV is stale, markets are disorderly, and the lending protocol’s liquidation mechanism doesn’t work for the collateral type.
Mechanism 3: Shared Funding, Correlated Stress
Morpho’s isolated pool architecture means failures in one collateral market don’t cascade to others. The collateral side is genuinely isolated. The funding side is not.
From the contagion map: USDC connects 60 markets. USDT connects 14. Every RWA carry trade unwinds for the same reason: borrow rate exceeds collateral yield. This trigger is macro-driven and hits all positions simultaneously. When it does, the “isolated” pools fail together because they share:
The same stablecoin funding pools (MetaMorpho vaults allocate across markets; withdrawals from one reduce liquidity in others)
The same liquidation infrastructure (same bots, same MEV searchers, capacity-constrained during simultaneous stress)
The same oracle infrastructure (RedStone provides feeds for multiple assets; a failure affects all)
The same macro stress trigger (borrow rate spike driven by Fed policy, USDC supply, or DeFi leverage demand)
This is structurally identical to the pre-2008 SIV structure: isolated asset pools sharing the same commercial paper funding. When investors stopped rolling paper, all SIVs failed regardless of individual asset quality. The isolation was on the asset side. The fragility was on the funding side.
Mechanism 4: Regulatory Reclassification Risk
The three mechanisms above are market-driven. The fourth operates on a different timeline and with a different trigger, but widens the same gap.
On March 11, 2026, the SEC and CFTC signed a joint memorandum of understanding establishing a coordinated oversight framework for digital assets. Six days later, on March 17, both agencies jointly published Interpretive Release No. 33-11412, a 68-page document that formally establishes a token taxonomy for crypto assets. This is not pending guidance. It is live. SEC Chairman Atkins announced it at the DC Blockchain Summit: “After more than a decade of uncertainty, this interpretation will provide market participants with a clear understanding of how the Commission treats crypto assets under federal securities laws.” The taxonomy establishes five categories: digital commodities, digital collectibles, digital tools, payment stablecoins (under the GENIUS Act), and digital securities. The first four fall outside SEC jurisdiction. The fifth, digital securities -- defined as traditional securities that are tokenized -- remains fully subject to federal securities law. The release explicitly named 16 crypto assets as digital commodities, including Bitcoin, Ethereum, Solana, XRP, Dogecoin, Cardano, Avalanche, Chainlink, and Polkadot, placing them under CFTC jurisdiction. Staking, mining, and airdrops were cleared of securities law obligations.
The classification is already live. On March 3, the SEC submitted the interpretive framework to OIRA for interagency review. Fourteen days later, it was published as final guidance. Atkins told reporters the agency is planning to launch a formal rulemaking process "in a week or two," with additional crypto proposals to follow. The enforcement perimeter is no longer hypothetical. It is active.
On March 12, the Senate voted 89-10 to ban CBDCs, the most bipartisan crypto vote in U.S. history, embedded in the 21st Century ROAD to Housing Act. And separately, the CLARITY Act (which would regulate stablecoin issuers) remains stalled because the American Bankers Association rejected the White House compromise over whether stablecoin issuers should be allowed to offer yield.
Why this matters for the accounting-executable equity gap specifically. sACRED (Apollo), USTB (Superstate), mF-ONE (Midas), PRIME (Figure) are tokenized fund shares. Under the newly published taxonomy, they almost certainly fall into the fifth category -- digital securities, defined as "traditional securities that are tokenized" -- which remains fully subject to federal securities law regardless of the underlying technology. Until March 17, these tokens existed in a regulatory grey zone. That ambiguity was load-bearing: it meant protocols could list them as collateral without triggering securities law compliance requirements. The ambiguity is now gone. If classified as digital securities, every protocol listing them as collateral is potentially facilitating unregistered securities transactions. Every vault curator allocating depositor funds into these markets is potentially acting as an unregistered investment adviser. This is no longer a future risk contingent on a regulatory timeline. It is a present reality contingent on enforcement prioritization.
This doesn’t change the underlying credit quality of the collateral. It changes whether the token can legally be held, transferred, and redeemed by the parties involved. The “value” of sACRED as collateral is not just its NAV. It is its NAV times the probability that the legal infrastructure supporting it continues to function.
We know what regulatory classification triggers look like. When the SEC sued Paxos over BUSD in 2023, BUSD saw roughly 90% redemptions within weeks. Celsius and BlockFi were effectively 100%. Regulatory action triggers binary withdrawal, not gradual. Curators would face an immediate decision: maintain exposure to what might be an unregistered security, or exit. Institutional borrowers on Aave Horizon, who are already leaving (Section II data), would have even more reason to pull back. And collateral that is already illiquid becomes harder to liquidate, because now a liquidator isn’t just holding a quarterly-redemption fund share; they’re potentially holding an unregistered security.
So the gap widens from all four directions simultaneously: the collateral is already illiquid (Mechanism 1), the price is already stale (Mechanism 2), the funding is correlated (Mechanism 3), AND legal uncertainty attaches to whether the token can even be transacted (Mechanism 4). Accounting equity stays the same on the dashboard. Executable equity drops further.
The paradox: The market reads regulatory clarity as bullish. “Clarity = legitimacy = institutional capital.” At the macro level, that’s probably right. But at the protocol level, clarity means enforcement becomes cheap, fast, and precedented. The same regulatory clarity that brings institutional capital into crypto broadly enables enforcement against specific concentrated nodes in the infrastructure. Before the MOU, regulators couldn’t easily target DeFi protocols because they couldn’t classify what the protocols were doing. Every enforcement action was a legal experiment. That ambiguity was a shield. The MOU and token taxonomy remove the shield.
And the infrastructure sitting under the new enforcement perimeter is concentrated. MetaMorpho vault concentration data tells the story:
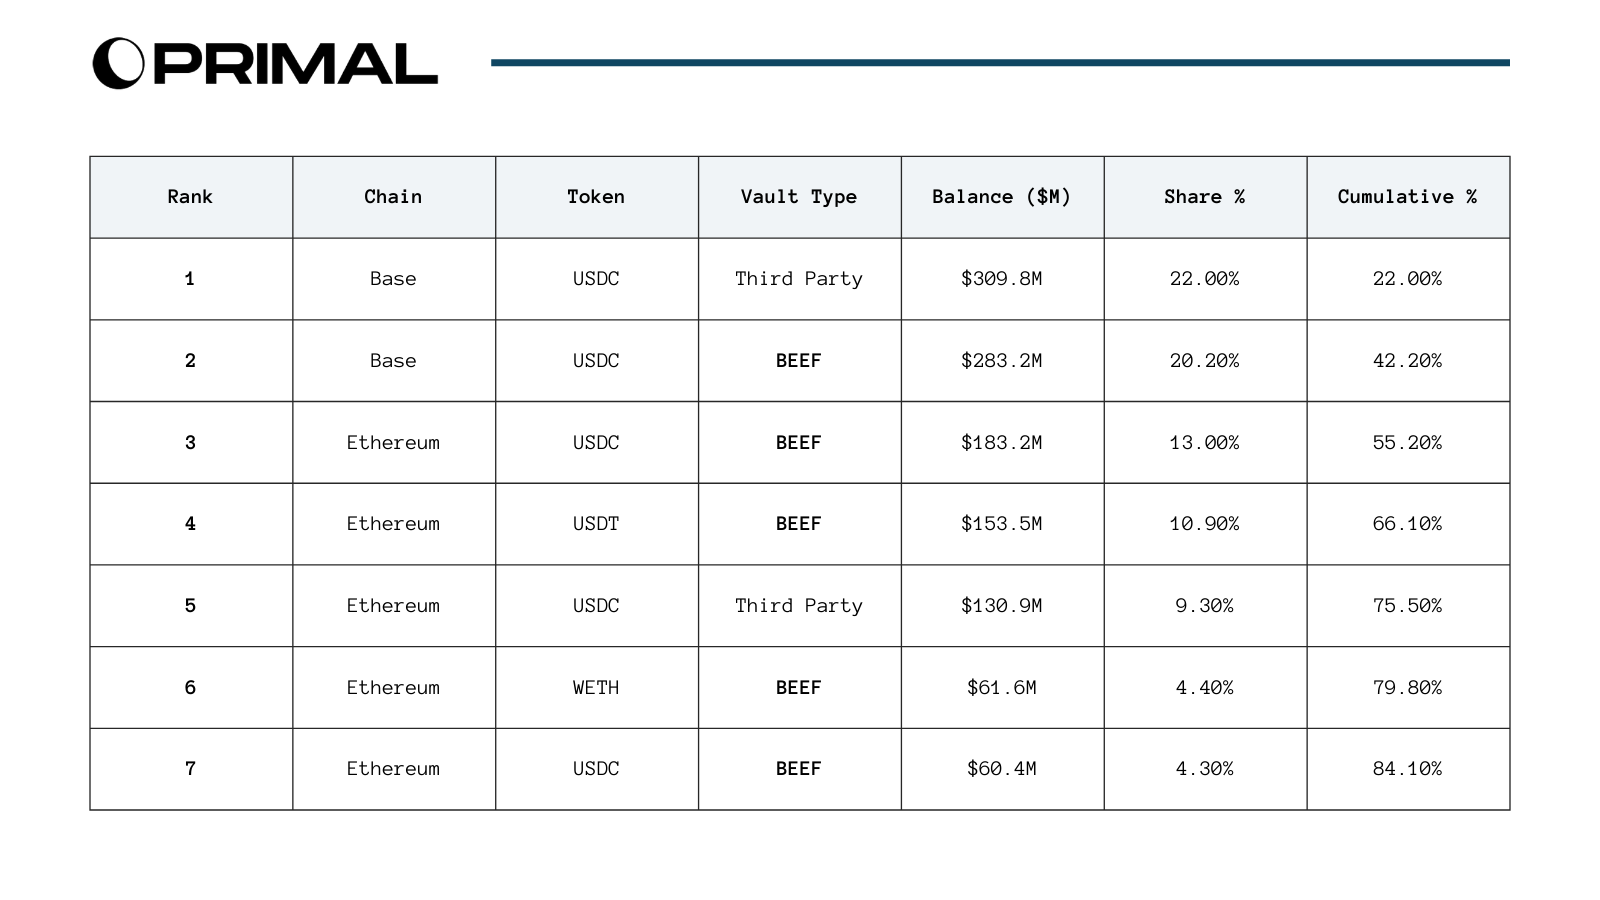
The concentration numbers are worse than the headline suggests. Five vaults control 75.5% of all MetaMorpho TVL. But within that top 5, three are BEEF vaults (Morpho Labs’ own). Morpho Labs directly controls 54.4% of all vault TVL through its BEEF products. The HHI of 1,330 bps classifies as concentrated by DOJ/FTC standards (financial market regulators use lower thresholds than the 2,500 merger guideline). The effective number of vaults is 7.5, meaning the entire $1.4B MetaMorpho system behaves as if it had fewer than 8 independent participants.
For regulatory risk, this concentration means a single enforcement action against a single curator -- or against Morpho Labs itself -- doesn’t just affect one vault. It affects 54.4% of all depositor capital. If the token taxonomy classifies RWA collateral tokens as securities, Morpho Labs’ BEEF vaults holding $742M in stablecoin and ETH deposits allocated to markets backed by those tokens face immediate legal exposure. A single enforcement action has disproportionate blast radius because the infrastructure is concentrated, not distributed.
The token taxonomy is published. The question now is enforcement cadence. I am watching: the formal rulemaking Atkins promised within weeks of March 17. The CLARITY Act, which passed the House in July 2025 and cleared the Senate Agriculture Committee in January 2026 but still requires Senate Banking Committee markup, and whether it passes with stablecoin yield restrictions (70%+ of Morpho vaults are USDC-denominated; Circle is directly in the crosshairs). And the first enforcement action against any vault curator anywhere in DeFi. The interpretive release is not yet a formal rule, but as Bloomberg reported, commission-level guidance is "generally viewed to be more enforceable when compared to staff-level statements." The shield of ambiguity is gone.
VI. The Yield Spread Under the Microscope
The equation:
Net Yield = (RWA Yield x Leverage) - (Borrow Rate x (Leverage - 1))
At advertised rates: 8% yield, 4% borrow, 2x leverage = 12% net. Three factors erode this.
Subsidy 1: Incentivized Yields
Coinbase Head of Consumer Products Max Branzburg acknowledged on X that roughly 6% of Coinbase’s 10.8% USDC lending yield comes from organic activity on Morpho, while an additional 5% is a temporary “boost” from the protocol itself -- meaning nearly half the advertised yield is subsidy, not market-driven lending returns.
Aave Horizon runs capped incentive programs (4% RLUSD, 3% USDC).
Kamino deployed $500K in coordinated incentives with Maple.
Strip subsidies: organic spreads are 1-3%.
Subsidy 2: Suppressed Borrow Rates
DeFi lending rates converged with SOFR due to supply glut: Sky’s $1B to tokenized Treasuries, Bitwise vaults at 6%, Coinbase routing users into Morpho. This capital is mercenary. When rates spike (Aave hit 99.85% utilization in Feb 2026), it leaves.
Subsidy 3: Unpriced Risk (Indicative Estimates)
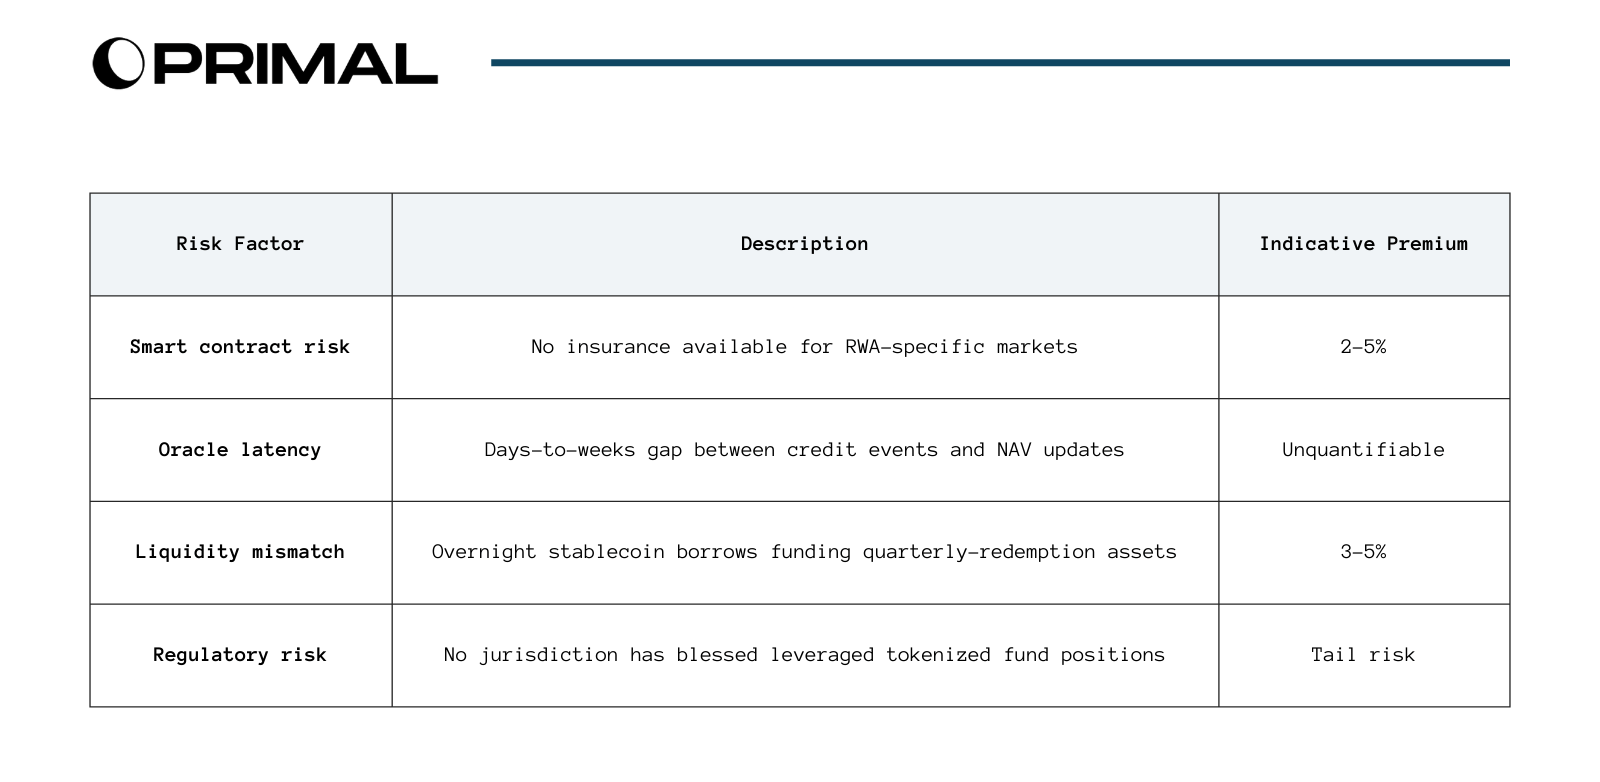
The “16% amplified yield” is gross. After risk adjustment, it likely delivers returns comparable to the unleveraged fund. The leverage isn’t creating alpha. It’s creating the illusion of alpha by taking uncompensated risks.
VII. The Incentive Stack: Who Earns What, Who Bears What
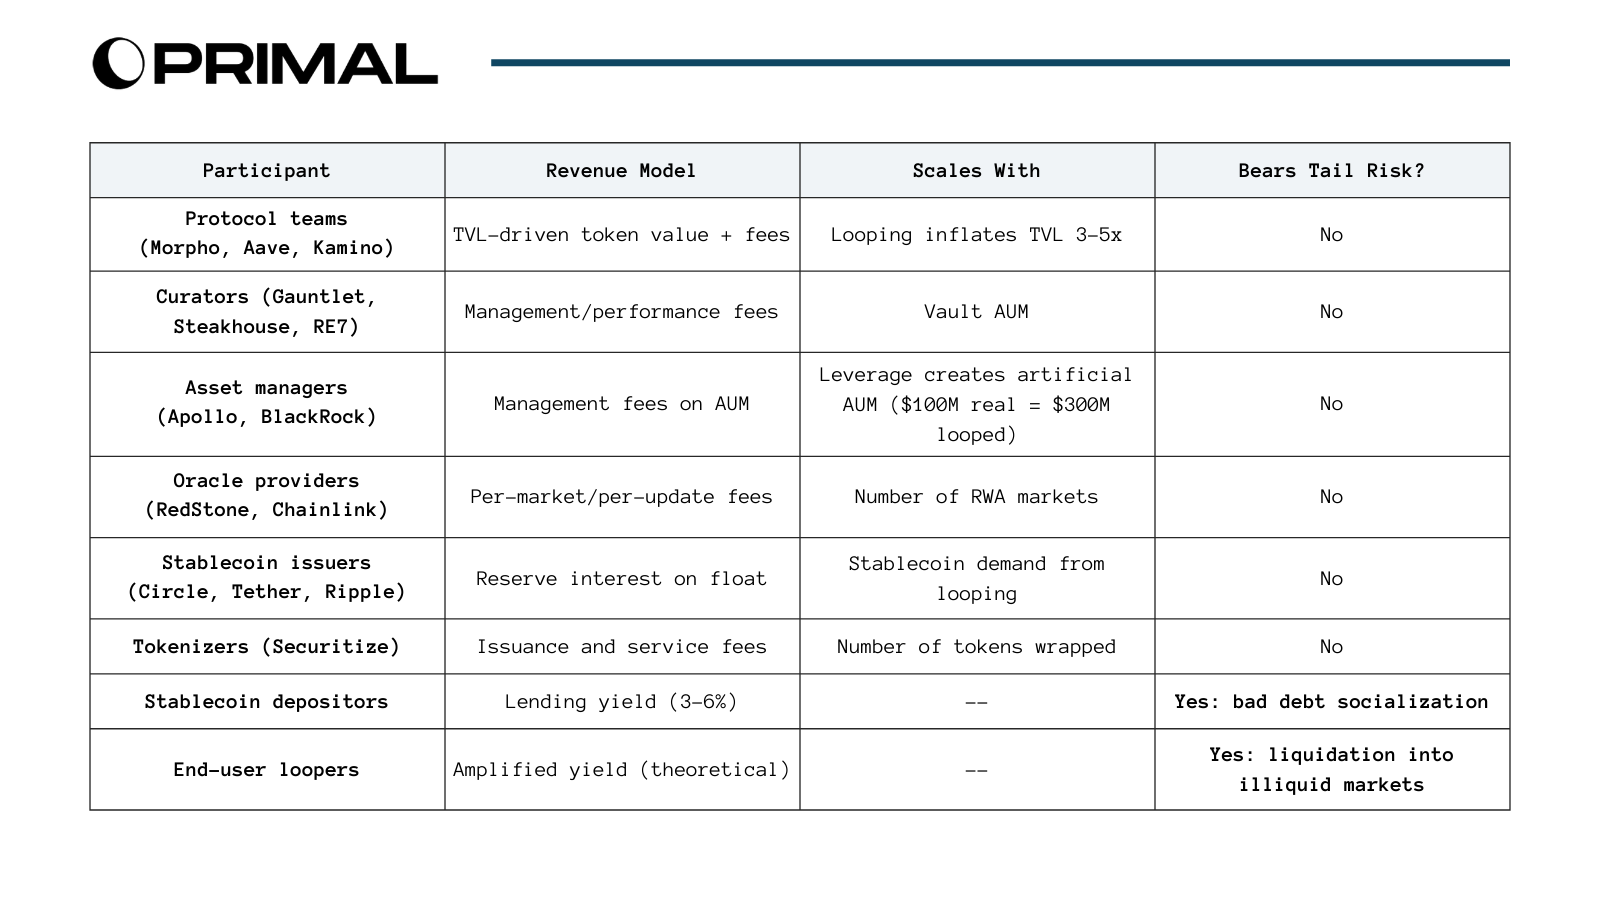
The agency problem is old.
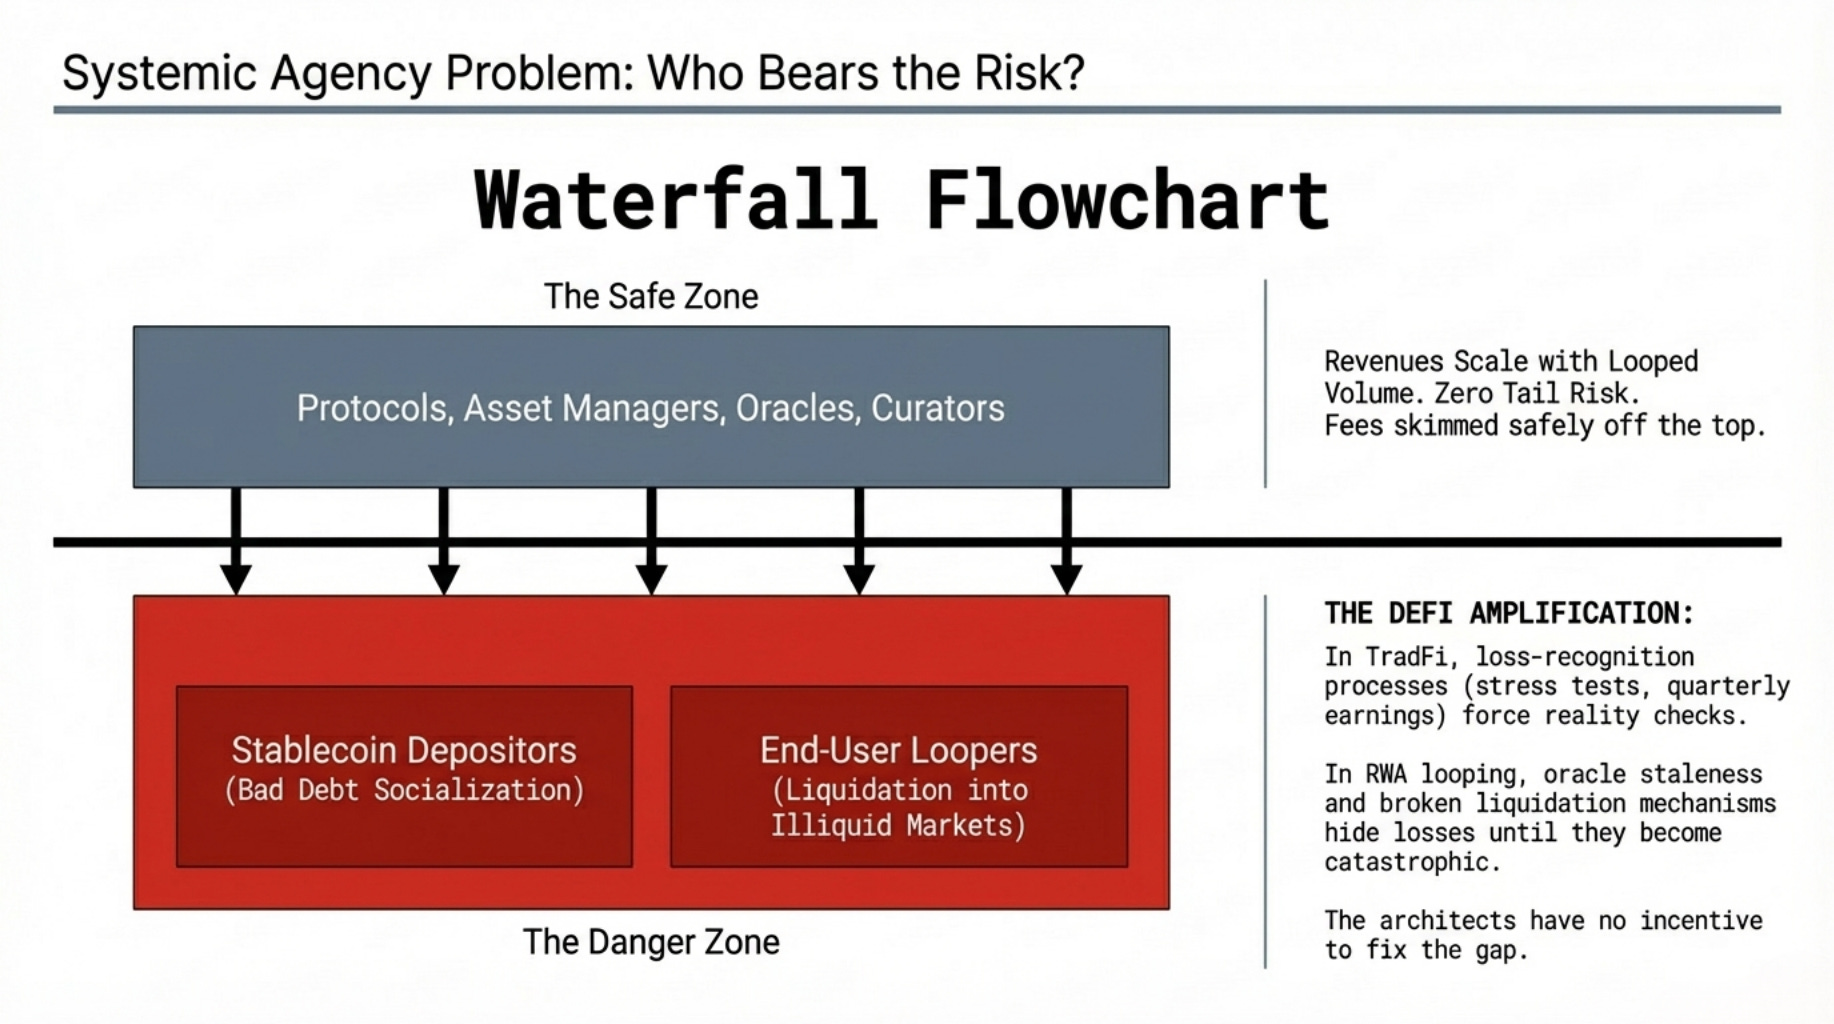
The amplification is new. In TradFi, banks profit from loan volume and taxpayers bear the tail via FDIC and bailouts. The pattern is as old as banking. What’s unique in DeFi RWA looping is the amplification: oracle staleness hides losses for weeks, the liquidation mechanism doesn’t work for the collateral type, and there is no loss-recognition process (no mark-to-market requirements, no regulatory stress tests, no quarterly earnings call) that forces anyone to acknowledge deterioration before it becomes catastrophic.
VIII. The Unwind Scenario
This is not hypothetical. The early phases have already played out.
February 2026 on Aave: Trend Research held a ~$2B leveraged ETH long, one of the largest single positions in DeFi history. When the position unwound, 332K ETH was sold to repay stablecoin debt. WETH deposits dropped from 3.45M to 2.9M ETH in a single week. Utilization spiked to 95.4%. Then a $144M whale withdrawal pushed it to 99.85% -- effectively locking every remaining lender out of their capital. Both resolved in days because the collateral was liquid ETH.
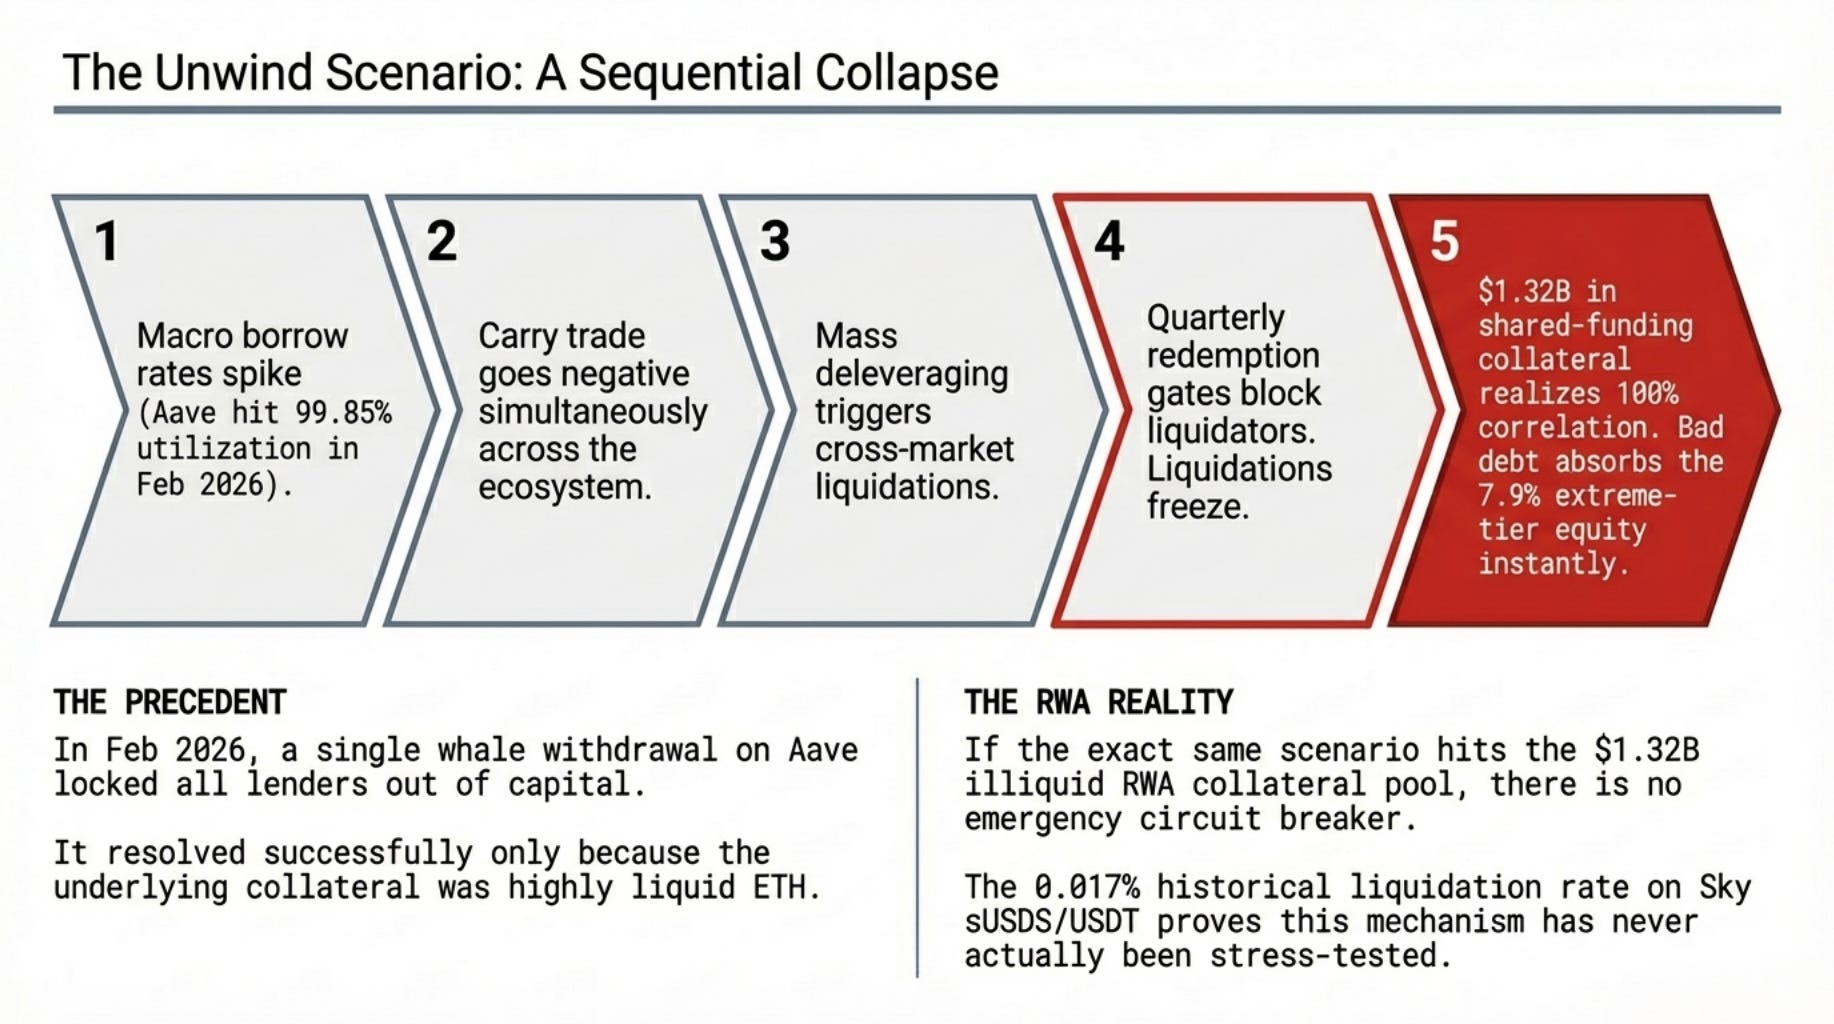
Now apply the same scenario to illiquid RWA: borrow rate spikes, carry goes negative, everyone deleverages simultaneously, nobody can sell their collateral (quarterly gates), liquidators won’t bid, bad debt accumulates, “isolated” pools fail together through shared USDC/USDT funding, oracle catches up weeks later revealing positions were underwater before liquidations triggered.
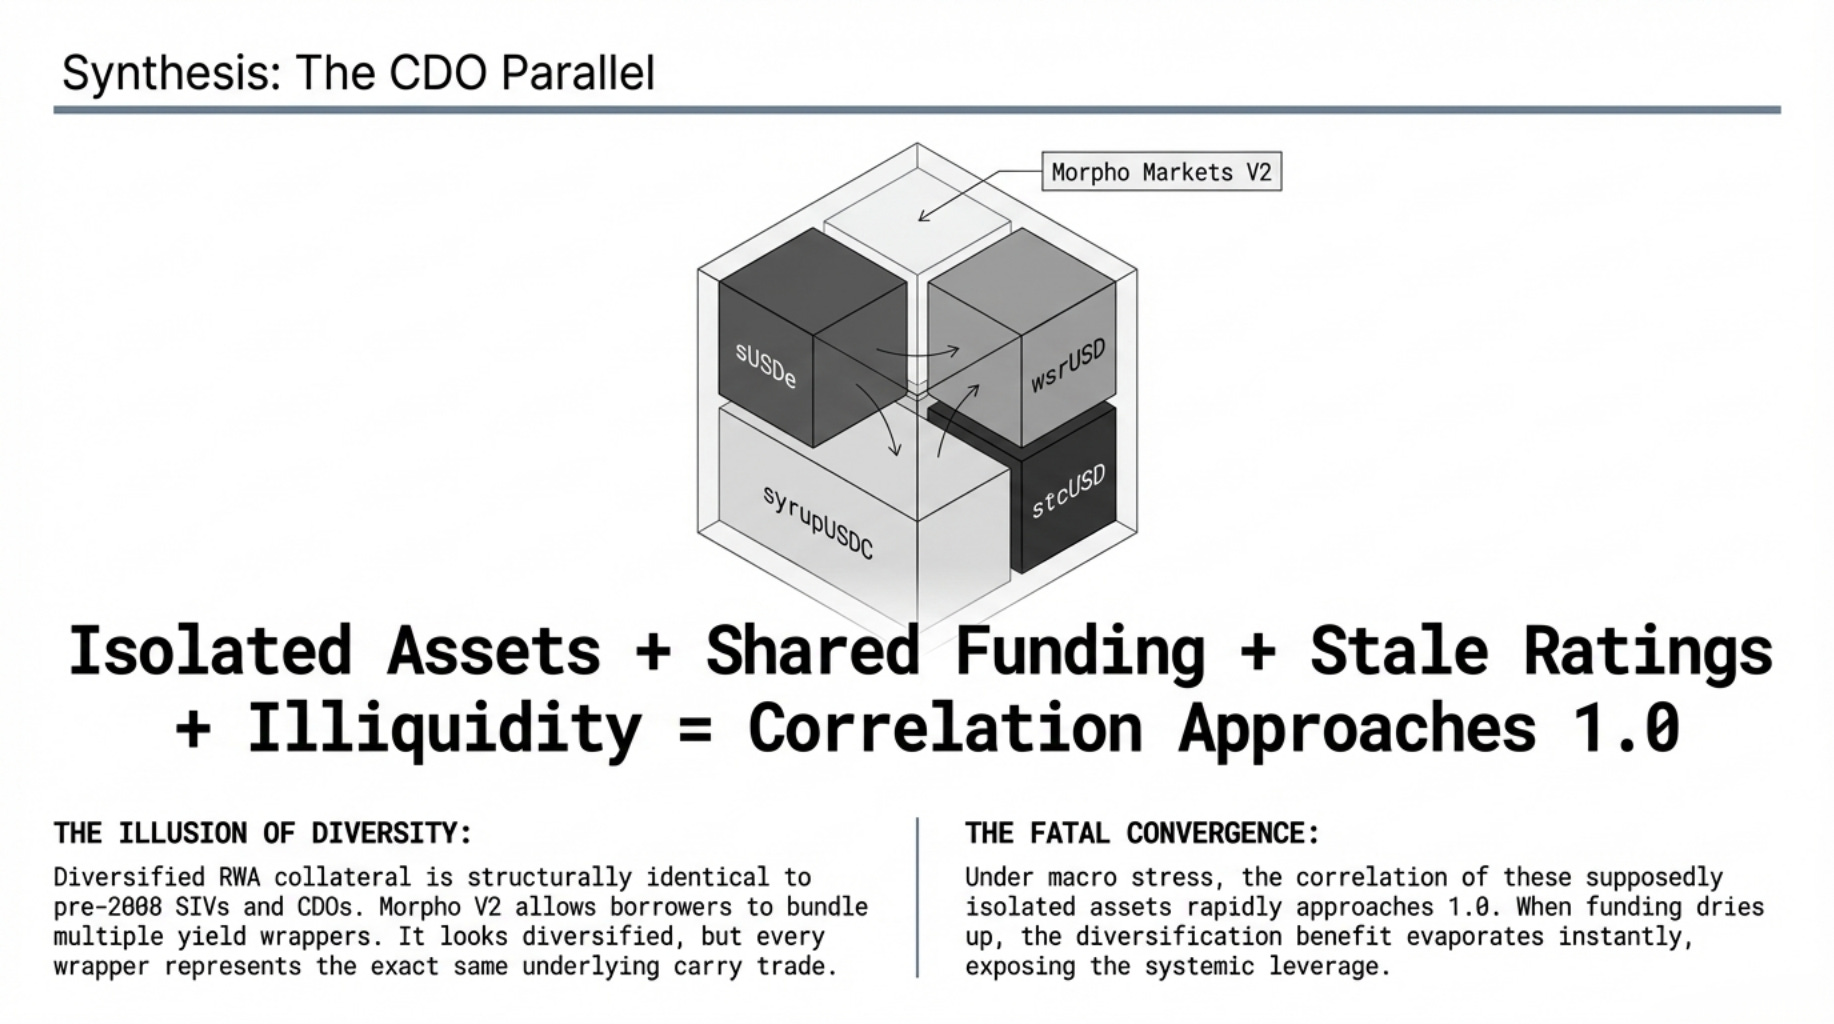
The CDO parallel nobody wants to name: Morpho's V2 upgrade -- with Vaults V2 already live and Markets V2 expected to deploy later in 2026 -- will introduce portfolio collateral, letting borrowers bundle multiple yield wrappers as a single collateral position. sUSDe + syrupUSDC + stcUSD as "diversified RWA collateral." Three protocols. Three yield sources. Looks diversified. But all four are the same trade: yield-bearing stablecoin wrapper looped against stablecoin borrows. Same risk factor. Same unwind trigger. Same macro sensitivity. This is structurally identical to a CDO: bundling correlated exposures, slicing them into tranches, and marketing the result as diversified. The correlation is invisible in normal markets and approaches 1.0 under stress.
The question isn’t whether this happens. It’s how much capital gets deployed before it does. Right now: $1.32B in high-leverage positions with $151M in accounting equity. Growing weekly.
IX. What Would Close the Gap
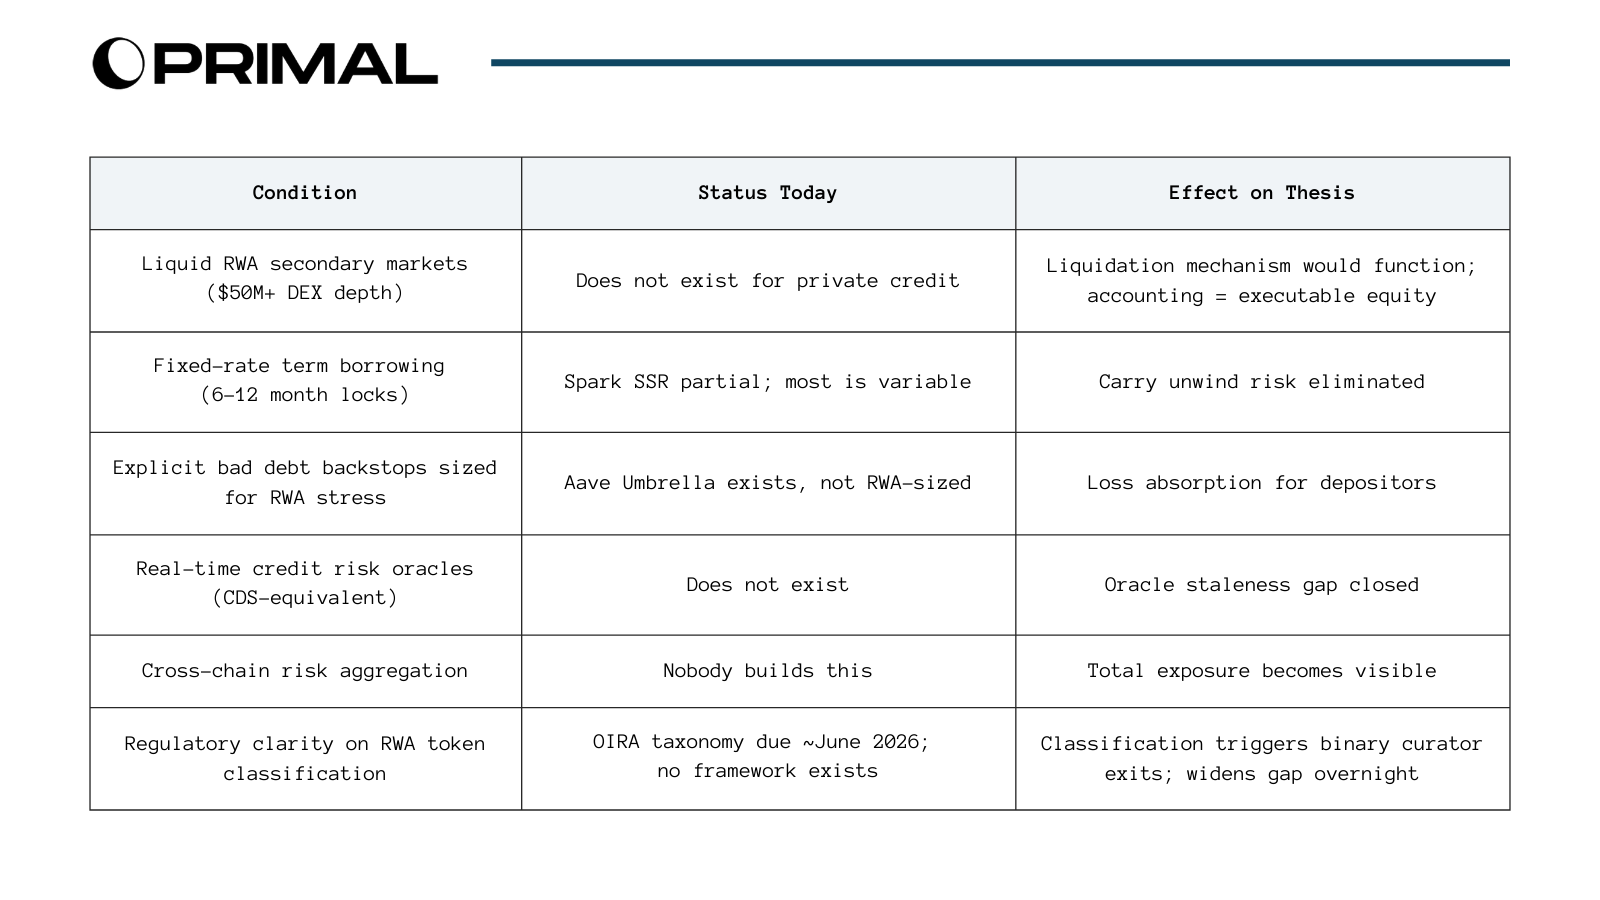
None seem likely from the current participants, and that’s the point. Every entity profiting from the current structure -- protocols, curators, asset managers, oracle providers, stablecoin issuers -- earns fees proportional to volume. Closing the gap would reduce volume by making the true risk-adjusted yield visible (and unimpressive). The incentive to fix it does not come from inside the house.
It comes from outside. The same gap that makes the current system fragile is the market opportunity for new infrastructure. This is not a contradiction. It’s the classic venture setup: incumbents won’t cannibalize their own economics, so the fix comes from new entrants who capture value by solving the problem the incumbents need solved but won’t build themselves.
X. Investment Implications: Where Value Accrues If the Gap Gets Closed
If the gap between accounting equity and executable equity is the risk, the investable opportunity is in closing it. None of the following exist today. All of them would be immediately adopted by every lending protocol in the space, because the alternative is waiting for the gap to blow up in production:
Real-time credit risk oracles. The protocol that builds continuous credit risk pricing for onchain private credit, not NAV relays but CDS-equivalent feeds, captures the most valuable position in the entire RWA stack. This is the single biggest unsolved problem. Every lending protocol, every curator, every risk manager needs it. Nobody has it.
Specialized liquidation infrastructure. Distressed debt funds operating onchain: entities willing to hold interval fund positions through 90-day redemption queues at calibrated discounts, with the capital reserves and risk appetite to serve as liquidators of last resort. Greenfield market. No participants today.
Fixed-rate, duration-matched lending. Protocols offering 6-12 month stablecoin borrows matched to RWA collateral duration. This eliminates the overnight-funding-on-quarterly-asset mismatch. The market wants this. Nobody has built it at scale.
Cross-chain risk aggregation. Apollo’s sACRED on Morpho (Ethereum), Gauntlet (Polygon), Kamino (Solana), Drift (Solana). Total leveraged exposure: unknown. First to aggregate this creates an informational moat and a public good.
The picks-and-shovels thesis holds. Whoever wins the tokenized fund race, the infrastructure that closes the gap captures value regardless. The four products above represent the missing layers in the RWA looping stack. The first movers in each will define the next generation of DeFi infrastructure.
Methodology
We built six custom Dune Analytics queries:
Our central analytical distinction throughout this research has been focused between accounting equity (the arithmetic difference between collateral value and debt, as reported by the protocol) and executable equity (the value recoverable through the liquidation mechanism under stress).
For liquid DeFi collateral, these converge.
For illiquid RWA collateral with redemption gates, stale NAV pricing, and no secondary market depth, the divergence between them is the risk.
Find Primal Capital at PrimalCapital.io and on X @0xPrimal
Author: Arhat Bhagwatkar (Partner, Primal Capital)
Disclaimer
This research is published by Primal Capital Research for informational purposes only. It is not financial, legal, or investment advice. Nothing in this piece constitutes a recommendation to buy, sell, or hold any asset, token, or protocol mentioned. Market conditions, protocol parameters, and regulatory frameworks change rapidly. The data presented here is a snapshot, not a live feed.
 | A guest post by
|